
Concept explainers
Videos
a .
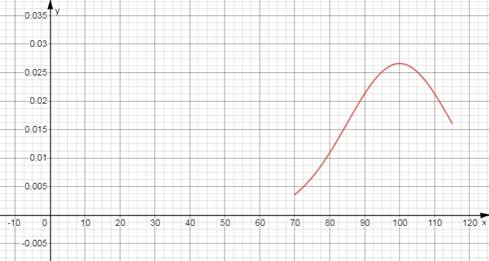
To graph: the given function.
a .
Answer to Problem 39E
Explanation of Solution
Given:
The IQ scores for a sample of students at a small college roughly follow the
Where x is the IQ score.
The graph of the function
b .
To estimate: the average IQ score of a student using the above graph.
b .
Answer to Problem 39E
100
Explanation of Solution
Given:
The IQ scores for a sample of students at a small college roughly follow the normal distribution
Where x is the IQ score.
The graph of the function
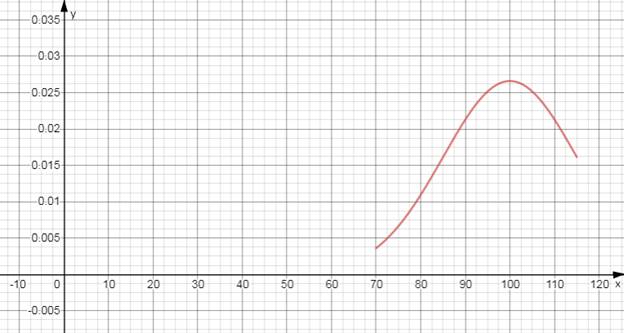
The average IQ score of a student is given by the x -coordinate of the highest point of the graph.
In this case the x -value corresponding to the maximum y -value is 100.
Conclusion:
The average IQ score of a student is 100.
Chapter 3 Solutions
EBK PRECALCULUS W/LIMITS


 Calculus: Early TranscendentalsCalculusISBN:9781285741550Author:James StewartPublisher:Cengage Learning
 Thomas' Calculus (14th Edition)CalculusISBN:9780134438986Author:Joel R. Hass, Christopher E. Heil, Maurice D. WeirPublisher:PEARSON
 Calculus: Early Transcendentals (3rd Edition)CalculusISBN:9780134763644Author:William L. Briggs, Lyle Cochran, Bernard Gillett, Eric SchulzPublisher:PEARSON
 Calculus: Early TranscendentalsCalculusISBN:9781319050740Author:Jon Rogawski, Colin Adams, Robert FranzosaPublisher:W. H. Freeman
 Calculus: Early Transcendental FunctionsCalculusISBN:9781337552516Author:Ron Larson, Bruce H. EdwardsPublisher:Cengage Learning