
Concept explainers
Videos
a.
To use a graphing utility to plot the data points  and
and 
a.
Explanation of Solution
Given Information:
Given, initial temperature of the cup of water is  and room temperature is
The ordered pairs are

Calculation:
Now, to plot the data points for  and
and 
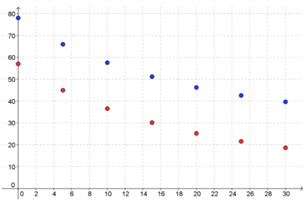
First, subtract the room temperature from each ordered pair.
Therefore, the ordered pairs for are

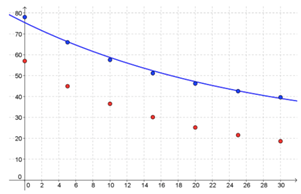
So, the data points are obtained as below.
The blue dots represent, whereas the red dots represent
b.
To solve for  and graph the model.
b.
Explanation of Solution
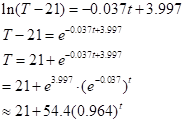
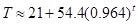
Exponential model for the data of  is
is 
So, 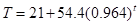
The graph is shown below:

It can be seen that the graph matches the original given data accurately.
c.
To solve for  and graph the model.
c.
Answer to Problem 89E
The width of the arch will be 
Explanation of Solution
For the points corresponding to  then get a straight line.
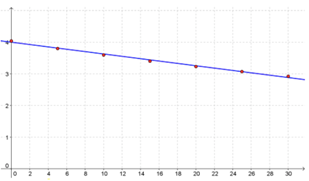
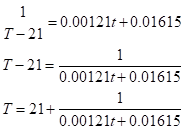
The equation of the line is
Here, 
So,
Hence,
d.
To use a graphing utility to plot the data points  and
and 
d.
Explanation of Solution
For the points corresponding to  then get a straight line.
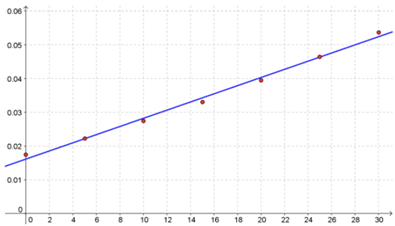
The equation of the line is
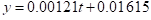
Here, 
So,
Hence, the graph is as shown below:
It can be seen that the graph matches the original given data accurately.
Chapter 3 Solutions
EBK PRECALCULUS W/LIMITS


 Calculus: Early TranscendentalsCalculusISBN:9781285741550Author:James StewartPublisher:Cengage Learning
 Thomas' Calculus (14th Edition)CalculusISBN:9780134438986Author:Joel R. Hass, Christopher E. Heil, Maurice D. WeirPublisher:PEARSON
 Calculus: Early Transcendentals (3rd Edition)CalculusISBN:9780134763644Author:William L. Briggs, Lyle Cochran, Bernard Gillett, Eric SchulzPublisher:PEARSON
 Calculus: Early TranscendentalsCalculusISBN:9781319050740Author:Jon Rogawski, Colin Adams, Robert FranzosaPublisher:W. H. Freeman
 Calculus: Early Transcendental FunctionsCalculusISBN:9781337552516Author:Ron Larson, Bruce H. EdwardsPublisher:Cengage Learning