
CAMPBEL BIOLOGY:CONCEPTS & CONNECTIONS
10th Edition
ISBN: 9780136538820
Author: Taylor
Publisher: INTER PEAR
expand_more
expand_more
format_list_bulleted
Concept explainers
Videos
Textbook Question
Chapter 34, Problem 19TYK
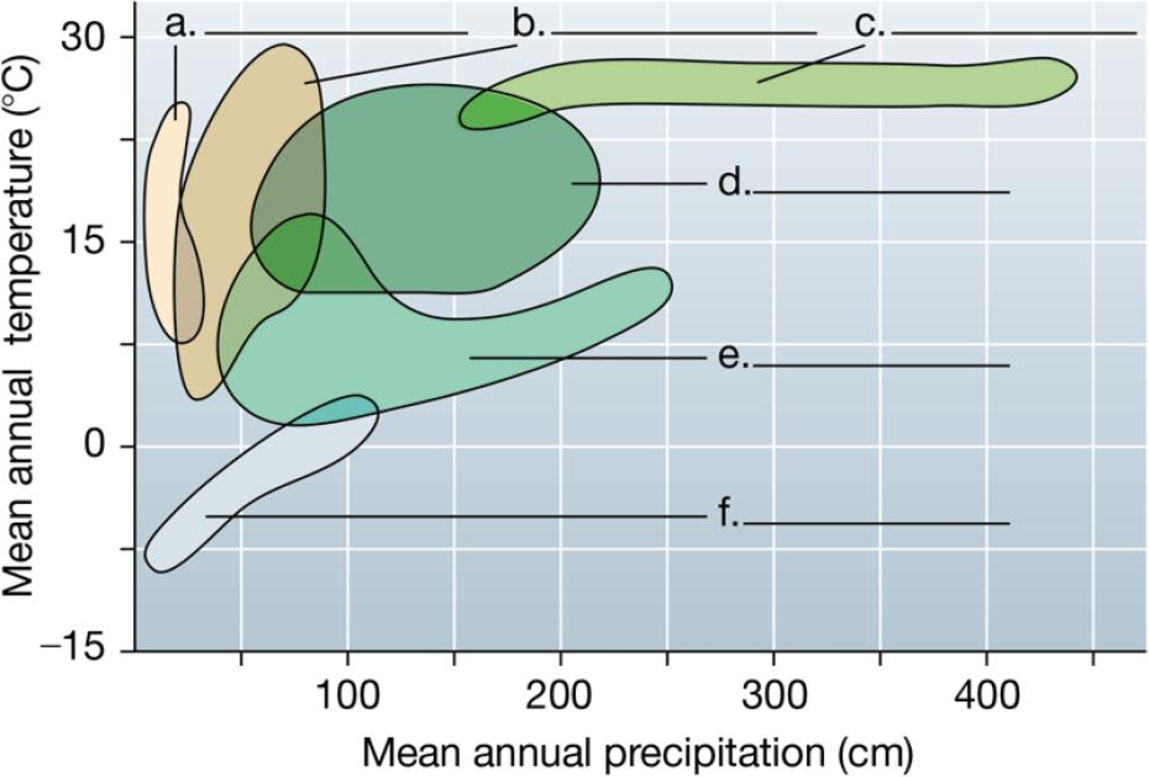
In the climograph below, biomes are plotted by their range of annual mean temperature and annual mean precipitation. Identify the following biomes: arctic tundra, coniferous forest, desert, grassland, temperate forest, and tropical forest. Explain why there are areas in which biomes overlap on this graph.
Expert Solution & Answer
Want to see the full answer?
Check out a sample textbook solution
Students have asked these similar questions
Look at the following temperature and precipitation graph for a city around the world. Using this information, write down which biome each city has in it. Be careful to read the numbers along The numbers along the Y-axis carefully. For precipitation, you will need to look at figure 2.2, which has annual precipitation numbers in centimeters. Then compare them to the monthly precipitation numbers in the graph, which are in millimeters. It may be helpful to add up The graph numbers and convert that number to centimeters in order to determine the Biome. Average temperatures are also represented on figure 2.2.
Answer choices
A. Desert
B. Tropical rain forest
C. Temperate grassland
D. Tundra
Identify the following biomes on the graph below: tundra, coniferous forest, desert, grassland, temperate broadleaf forest, and tropical rain forest.
The table below shows monthly average temperature and precipitation data for 6 different biomes
(A-F) as well as the annual mean and standard deviations of the mean for both those factors at the
bottom of each column.
Biome A
Biome B
Biome C
Biome D
Biome E
Biome F
Temp
Precip
Temp
Precip
Temp
Precip
Temp
Precip
Temp
Precip
Temp
Precip
Jan
12
0.5
-0.5
25
2.
35
-30
2.
Feb
13
0.4
-0.4
26
12
2.5
-30
-25
Mar
15
0.5
7
26
27
-25
-18
1.5
Apr
21
0.4
7.5
26
28
2.5
May
25
0.4
15
25
29
1.5
10
Jun
28
0.3
18
8.5
25
28
20
3.5
Jul
35
0.2
20
26
29
10
18
4
Aug
34
0.3
19
8
24
28
20
Sep
30
0.3
17
25
27
18
2
10
2.4
Oct
20
0.4
12
26
16
12
4
10
1.5
4
2.3
Nov
18
10
27
12
3
-25
-18
2.1
Dec
12
-1
5.5
27
10
-1
-28
-25
mean
21.92
0.48
9.76
6.79
25.67
21.25
8.83
4.71
13.75
1.54
4.58
2.48
st dev.
8.38
0.26
8.34
1.25
0.89
8.52
10.62
2.18
15.53
0.69
17.95
0.70
Your job is to create a graph with each of the six biomes presented as a venn plot using the
technique described in the introduction to the worksheet. You can…
Chapter 34 Solutions
CAMPBEL BIOLOGY:CONCEPTS & CONNECTIONS
Ch. 34 - You have seen that Earths terrestrial biomes...Ch. 34 - The most complex and diverse biome a. chaparral b....Ch. 34 - Ground permanently frozen a. chaparral b. savanna...Ch. 34 - Prob. 4TYKCh. 34 - Limited to small coastal areas a. chaparral b....Ch. 34 - Spruce, fir, pine, and hemlock trees a. chaparral...Ch. 34 - Home of ants, antelopes, and lions a. chaparral b....Ch. 34 - Prob. 8TYKCh. 34 - Prob. 9TYKCh. 34 - What makes the Gobi Desert of Asia a desert? a....
Ch. 34 - Prob. 11TYKCh. 34 - Prob. 12TYKCh. 34 - Phytoplankton are the major photosynthesizers in...Ch. 34 - Prob. 14TYKCh. 34 - Prob. 15TYKCh. 34 - Prob. 16TYKCh. 34 - Prob. 17TYKCh. 34 - Aquatic biomes differ in levels of light,...Ch. 34 - In the climograph below, biomes are plotted by...Ch. 34 - Prob. 20TYKCh. 34 - SCIENTIFIC THINKING In 1954, workers at Michigan...
Knowledge Booster


Learn more about
Need a deep-dive on the concept behind this application? Look no further. Learn more about this topic, biology and related others by exploring similar questions and additional content below.Similar questions
- Which of the following BIOTIC influence or potentially determine the vegetation biome of a terrestrial region? Grazing Amount of rainfall Mean temperature/length of growing season Mean temperature/length of growing seasonarrow_forwardCreate a bar graph that ranks the given ecosystems from least productive to most productive. Title your graph, label each axis, label each bar, and provide units of measurement. Use the data in the table below showing net primary productivity of major ecosystems of the world: Ecosystem Net Primary Productivity (kcal/m2/yr) coniferous forests 3,500 deciduous forests 6,000 deserts 500 estuaries 9,000 freshwater ecosystems 2,000 grasslands 2,500 oceans 1,000 swamps 9,000 tropical rain forests 9,000 tundra 750arrow_forwardDraw a typical climate diagram for a tropical rainforest. Label all parts of the diagram and describe all of the types of information an ecologist could glean from such a diagram. Now draw a climate diagram for a desert. How does it differ from your rainforest climatograph, and what does this tell you about how the two biomes differ?arrow_forward
- Select the correct terms: The biome characterized by shrubs and nonwoody plants that grow in regions with cool, rainy winters and hot, dry summers is (tundra / chaparral). Another biome with few trees, but in this case dominated by grasses and nonwoody plants, is (grassland / tundra). The most productive aquatic biome is (freshwater / estuaries).arrow_forwardChoose a specific biome between the marine, freshwater, or any terrestrial biome. Discuss the types of plants and animals in that biome. Describe the climate and any non-living components (such as water, rocks, soil) of the biome. Where can the biome be found? What biogeochemical cycles occur in this biome? Are there any reservoirs for the nutrients? Where can the nutrients be found and what processes do they go through as they transition to a different reservoir? Describe at least two of the biogeochemical cycles and the nutrients and minerals that move through them in your chosen biome.arrow_forwardTrends Along Latitude Lines Use the globe icon to change the view to a flat map, and use the gear icon to turn “on” the gridlines. Scan across the globe along each of the latitude lines listed below, and record the biome types present. Latitude Biomes noted at this latitude 60°N 45°N 30°N 15°N 0° In 3-4 sentences, please summarize what you discovered regarding patterns of biome distribution in relation to latitude. Try to include points gathered from lecture material (or earlier in this lab exercise) to deepen your understanding.arrow_forward
- The graph illustrates the temperature and precipitation conditions in various terrestrial biomes. a) Based on the information in the graph, describe the air temperature range for a boreal forest. (b) Based on the information in the graph, identify the major grassland present within 20 degrees north and south of the equator.arrow_forwardwhich biome is the hottest and coldest and wettest to driest in a diagram form. title, components labeled, units of measurement included. Biome Type Temperature (C) Precipitation (mm) Desert 8.6 74 Grassland 2.9 416 Boreal forest –0.3 643 Arctic tundra –4.1 480 Rain forest 19.7 1350 Temperate forest 4.3 810arrow_forwardGiven these large-scale climate patterns based on latitude, what might you expect in terms of the global distribution of primary productivity (e.g. where might you expect greater plant productivity)? (Select all that are true.) Higher productivity near equator because of more direct solar radiation. Higher productivity near equator because of overall more precipitation. Bands of lower productivity near 30° N and S because of drier air. Bands of lower productivity near poles because of drier air.arrow_forward
- Biome Type Temperature (C) Precipitation (mm) Desert 8.6 74 Grassland 2.9 416 Boreal forest –0.3 643 Arctic tundra –4.1 480 Rain forest 19.7 1350 Temperate forest 4.3 810 graph the biomes from wettest to driest graph the biomes from hottest to coldestarrow_forwardThe desert and tundra biomes receive about the same amount of rainfall per year. Compare the other characteristics of these two biomes.arrow_forwardA biome is characterized by seasonal rainfall (about 20 to 100 mm) and temperature (about -10 to 35OC). Globally, the biome is found around 30ON latitude, has many tree species that lose their leaves in the winter, some shrubs and grasses, insects, many medium to small-sized mammals, birds, lizards, and some snakes. This best describes a: Group of answer choices A. chaparral (temperate scrubland). B. boreal forest. C. temperate grassland. D. tropical rainforest. E. deciduous temperate forest.arrow_forward
arrow_back_ios
SEE MORE QUESTIONS
arrow_forward_ios
Recommended textbooks for you
 Human Anatomy & Physiology (11th Edition)BiologyISBN:9780134580999Author:Elaine N. Marieb, Katja N. HoehnPublisher:PEARSON
 Biology 2eBiologyISBN:9781947172517Author:Matthew Douglas, Jung Choi, Mary Ann ClarkPublisher:OpenStax
 Anatomy & PhysiologyBiologyISBN:9781259398629Author:McKinley, Michael P., O'loughlin, Valerie Dean, Bidle, Theresa StouterPublisher:Mcgraw Hill Education,
 Molecular Biology of the Cell (Sixth Edition)BiologyISBN:9780815344322Author:Bruce Alberts, Alexander D. Johnson, Julian Lewis, David Morgan, Martin Raff, Keith Roberts, Peter WalterPublisher:W. W. Norton & Company
 Laboratory Manual For Human Anatomy & PhysiologyBiologyISBN:9781260159363Author:Martin, Terry R., Prentice-craver, CynthiaPublisher:McGraw-Hill Publishing Co.
 Inquiry Into Life (16th Edition)BiologyISBN:9781260231700Author:Sylvia S. Mader, Michael WindelspechtPublisher:McGraw Hill Education
Human Anatomy & Physiology (11th Edition)
Biology
ISBN:9780134580999
Author:Elaine N. Marieb, Katja N. Hoehn
Publisher:PEARSON
Biology 2e
Biology
ISBN:9781947172517
Author:Matthew Douglas, Jung Choi, Mary Ann Clark
Publisher:OpenStax
Anatomy & Physiology
Biology
ISBN:9781259398629
Author:McKinley, Michael P., O'loughlin, Valerie Dean, Bidle, Theresa Stouter
Publisher:Mcgraw Hill Education,
Molecular Biology of the Cell (Sixth Edition)
Biology
ISBN:9780815344322
Author:Bruce Alberts, Alexander D. Johnson, Julian Lewis, David Morgan, Martin Raff, Keith Roberts, Peter Walter
Publisher:W. W. Norton & Company
Laboratory Manual For Human Anatomy & Physiology
Biology
ISBN:9781260159363
Author:Martin, Terry R., Prentice-craver, Cynthia
Publisher:McGraw-Hill Publishing Co.
Inquiry Into Life (16th Edition)
Biology
ISBN:9781260231700
Author:Sylvia S. Mader, Michael Windelspecht
Publisher:McGraw Hill Education
DIVERSITY IN PLANTS; Author: 7activestudio;https://www.youtube.com/watch?v=uJrks56FQIY;License: Standard YouTube License, CC-BY
Biology- Plant Kingdom - Diversity in Living Organisms - Part 4 - English - English; Author: Bodhaguru;https://www.youtube.com/watch?v=QFgQ74EvfDQ;License: Standard YouTube License, CC-BY