
To Spot the error:
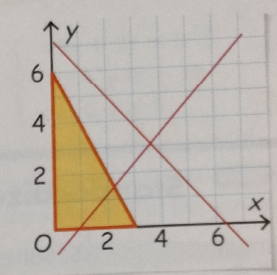
In the given graphical solution of a given Linear Programming Problem.
To find:
The correct solution of the given Linear Programming Problem.
The plot of the inequality
The maximum value of objective function is
Given:
The Linear Programming Problem:
The graphical solution.
Concepts Used:
Solving a Linear Programming Problem graphically.
Calculations:
Determine the feasible region by graphing the constraint inequalities. Also determine the corner points of the feasible region.
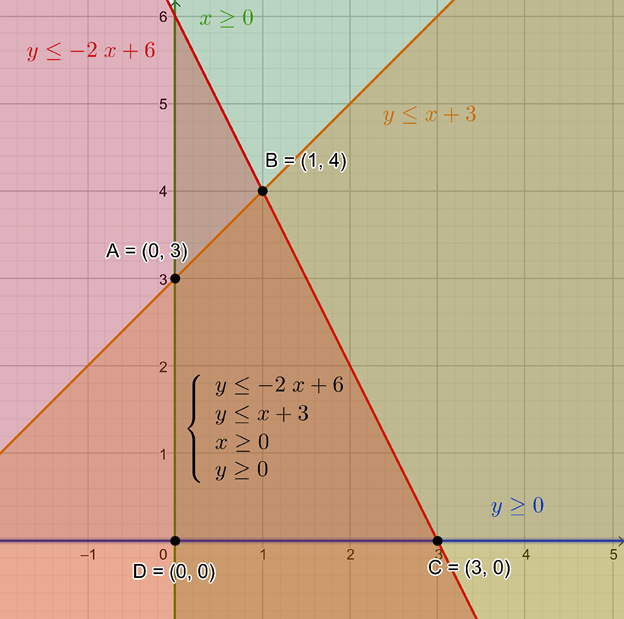
Comparing the above graph with the given graph it can be seen that the plot of the inequality
Evaluate the objective function
The maximum value of objective function is
Conclusion:
The plot of the inequality
The maximum value of objective function is
Chapter 3 Solutions
High School Math 2015 Common Core Algebra 2 Student Edition Grades 10/11

 Algebra and Trigonometry (6th Edition)AlgebraISBN:9780134463216Author:Robert F. BlitzerPublisher:PEARSON
 Contemporary Abstract AlgebraAlgebraISBN:9781305657960Author:Joseph GallianPublisher:Cengage Learning
 Linear Algebra: A Modern IntroductionAlgebraISBN:9781285463247Author:David PoolePublisher:Cengage Learning
 Algebra And Trigonometry (11th Edition)AlgebraISBN:9780135163078Author:Michael SullivanPublisher:PEARSON
 Introduction to Linear Algebra, Fifth EditionAlgebraISBN:9780980232776Author:Gilbert StrangPublisher:Wellesley-Cambridge Press
 College Algebra (Collegiate Math)AlgebraISBN:9780077836344Author:Julie Miller, Donna GerkenPublisher:McGraw-Hill Education