
To State:
A system of linear inequalities to model the given situation.
To Graph:
A system of linear inequalities that model the given situation.
The situation is modelled by the inequalities:
Given:
Balloons can be red or yellow only.
Total number of decoration balloons must be at least
There must be at least
Concepts Used:
Modelling a situational problem mathematically.
Graphing a set of linear inequalities.
Calculations:
Let number of red balloons be
The total number of balloons is
The number of yellow balloons
The situation is modelled by the inequalities:
Graph the inequality
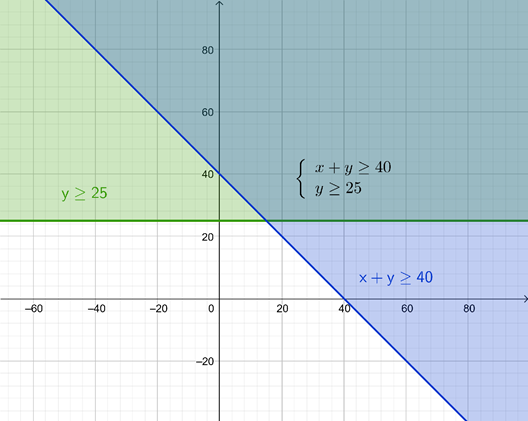
Conclusion:
The situation is modelled by the inequalities:
The solution area of the above system of inequalities is shown above graphically.
Chapter 3 Solutions
High School Math 2015 Common Core Algebra 2 Student Edition Grades 10/11

 Algebra and Trigonometry (6th Edition)AlgebraISBN:9780134463216Author:Robert F. BlitzerPublisher:PEARSON
 Contemporary Abstract AlgebraAlgebraISBN:9781305657960Author:Joseph GallianPublisher:Cengage Learning
 Linear Algebra: A Modern IntroductionAlgebraISBN:9781285463247Author:David PoolePublisher:Cengage Learning
 Algebra And Trigonometry (11th Edition)AlgebraISBN:9780135163078Author:Michael SullivanPublisher:PEARSON
 Introduction to Linear Algebra, Fifth EditionAlgebraISBN:9780980232776Author:Gilbert StrangPublisher:Wellesley-Cambridge Press
 College Algebra (Collegiate Math)AlgebraISBN:9780077836344Author:Julie Miller, Donna GerkenPublisher:McGraw-Hill Education