
Elementary Statistics Using The Ti-83/84 Plus Calculator, Books A La Carte Edition (5th Edition)
5th Edition
ISBN: 9780134688886
Author: Mario F. Triola
Publisher: PEARSON
expand_more
expand_more
format_list_bulleted
Concept explainers
Videos
Textbook Question
Chapter 3.3, Problem 22BSC
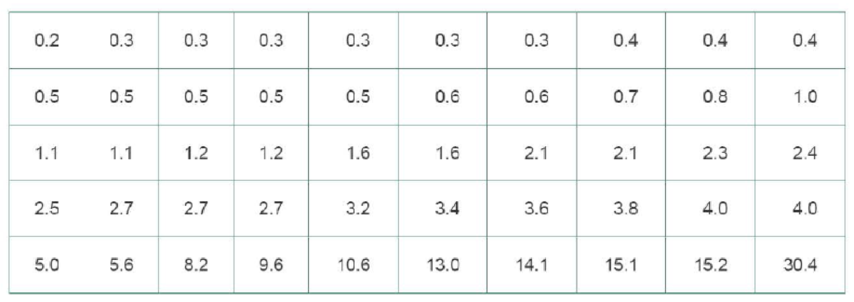
In Exercises 21–28, use the same list of Sprint airport data speeds (Mbps) given for Exercises 17–20. Find the indicated percentile or quartile.
22. Q1
Expert Solution & Answer
Want to see the full answer?
Check out a sample textbook solution
Students have asked these similar questions
A study is planned to compare the proportion of teenagers (ages 13–19) who dislike anchovies with the proportion of young adults (ages 20–30) who dislike anchovies. A random sample of 41 teenagers was taken, and 78% of them disliked anchovies. A random sample of 56 young adults was also taken, and 71% of them disliked anchovies.
Difference = Teenagers - Young Adults
The picture below is the question. Use the information above to help.
Determine whether the value 30% is a parameter or statistic:In a random sample of 80 students who passed statistics, 30% used statistics in their future careers
Statistic?
Parameter?
INSTRUCTION: Construct a HISTOGRAM for the Body Mass Index of the 40 patients with congestive heart failure following the four (4) Classes or Categories such as Underweight (< 18.5), Normal (18.5–24.9), Overweight (25–29.9), and Obese (≥ 30) for Female ONLY. Based on the graph, determine whether the histogram is normally distributed or skewed.
Table no. 1: Body mass index (BMI) values for male and female patients
Category for BMI (kg/m2 )
Male Patients
(FREQUENCY %)
Female Patients
(FREQUENCY %)
Total
Underweight (<18.5)
3 (15%)
4 (20%)
7 (17.5%)
Normal (18.5-24.9)
8 (40%)
9 (45%)
17 (42.5%)
Overweight (25-29.9)
5 (25%)
3 (15%)
8 (20%)
Obese (≥30)
4 (20%)
4 (20%)
8 (20%)
Total
20 (100%)
20 (100%)
40 (100%)
Chapter 3 Solutions
Elementary Statistics Using The Ti-83/84 Plus Calculator, Books A La Carte Edition (5th Edition)
Ch. 3.1 - Prob. 1BSCCh. 3.1 - Prob. 2BSCCh. 3.1 - Measures of Center In what sense are the mean,...Ch. 3.1 - Prob. 4BSCCh. 3.1 - Critical Thinking. For Exercises 520, watch out...Ch. 3.1 - Prob. 6BSCCh. 3.1 - Critical Thinking. For Exercises 520, watch out...Ch. 3.1 - Prob. 8BSCCh. 3.1 - Prob. 9BSCCh. 3.1 - Critical Thinking. For Exercises 520, watch out...
Ch. 3.1 - Critical Thinking. For Exercises 520, watch out...Ch. 3.1 - Prob. 12BSCCh. 3.1 - Prob. 13BSCCh. 3.1 - Prob. 14BSCCh. 3.1 - Critical Thinking. For Exercises 520, watch out...Ch. 3.1 - Critical Thinking. For Exercises 520, watch out...Ch. 3.1 - Prob. 17BSCCh. 3.1 - Critical Thinking. For Exercises 520, watch out...Ch. 3.1 - Prob. 19BSCCh. 3.1 - Critical Thinking. For Exercises 520, watch out...Ch. 3.1 - Prob. 21BSCCh. 3.1 - In Exercises 2124, find the mean and median for...Ch. 3.1 - Prob. 23BSCCh. 3.1 - In Exercises 2124, find the mean and median for...Ch. 3.1 - Prob. 25BSCCh. 3.1 - Prob. 26BSCCh. 3.1 - Prob. 27BSCCh. 3.1 - Prob. 28BSCCh. 3.1 - Prob. 29BSCCh. 3.1 - In Exercises 2932, find the mean of the data...Ch. 3.1 - Prob. 31BSCCh. 3.1 - Prob. 32BSCCh. 3.1 - Prob. 33BSCCh. 3.1 - Prob. 34BSCCh. 3.1 - Prob. 35BBCh. 3.1 - Prob. 36BBCh. 3.1 - Trimmed Mean Because the mean is very sensitive to...Ch. 3.1 - Prob. 38BBCh. 3.1 - Prob. 39BBCh. 3.1 - Prob. 40BBCh. 3.1 - Prob. 41BBCh. 3.2 - Range Rule of Thumb for Estimating s The 20 brain...Ch. 3.2 - Range Rule of Thumb for Interpreting s The 20...Ch. 3.2 - Variance The 20 subjects used in Data Set 8 IQ and...Ch. 3.2 - Symbols Identify the symbols used for each of the...Ch. 3.2 - In Exercises 520, find the range, variance, and...Ch. 3.2 - In Exercises 520, find the range, variance, and...Ch. 3.2 - In Exercises 520, find the range, variance, and...Ch. 3.2 - In Exercises 520, find the range, variance, and...Ch. 3.2 - Prob. 9BSCCh. 3.2 - Prob. 10BSCCh. 3.2 - Prob. 11BSCCh. 3.2 - Prob. 12BSCCh. 3.2 - Prob. 13BSCCh. 3.2 - Prob. 14BSCCh. 3.2 - Prob. 15BSCCh. 3.2 - Prob. 16BSCCh. 3.2 - Prob. 17BSCCh. 3.2 - Prob. 18BSCCh. 3.2 - Prob. 19BSCCh. 3.2 - In Exercises 520, find the range, variance, and...Ch. 3.2 - Prob. 21BSCCh. 3.2 - In Exercises 2124, find the coefficient of...Ch. 3.2 - Prob. 23BSCCh. 3.2 - Prob. 24BSCCh. 3.2 - Prob. 25BSCCh. 3.2 - Prob. 26BSCCh. 3.2 - Prob. 27BSCCh. 3.2 - Prob. 28BSCCh. 3.2 - Prob. 29BSCCh. 3.2 - Prob. 30BSCCh. 3.2 - Prob. 31BSCCh. 3.2 - Prob. 32BSCCh. 3.2 - Prob. 33BSCCh. 3.2 - Prob. 34BSCCh. 3.2 - Prob. 35BSCCh. 3.2 - Prob. 36BSCCh. 3.2 - Prob. 37BSCCh. 3.2 - Prob. 38BSCCh. 3.2 - Finding Standard Deviation from a Frequency...Ch. 3.2 - Prob. 40BSCCh. 3.2 - Prob. 41BSCCh. 3.2 - Prob. 42BSCCh. 3.2 - Prob. 43BSCCh. 3.2 - Chebyshevs Theorem Based on Data Set 3 Body...Ch. 3.2 - Prob. 45BBCh. 3.2 - Prob. 46BBCh. 3.3 - z Scores LeBron James, one of the most successful...Ch. 3.3 - Heights The boxplot shown below results from the...Ch. 3.3 - Boxplot Comparison Refer to the boxplots shown...Ch. 3.3 - z Scores If your score on your next statistics...Ch. 3.3 - z Scores. In Exercises 5-8, express all z scores...Ch. 3.3 - z Scores. In Exercises 5-8, express all z scores...Ch. 3.3 - Prob. 7BSCCh. 3.3 - z Scores. In Exercises 5-8, express all z scores...Ch. 3.3 - Significant Values. In Exercises 9-12, consider a...Ch. 3.3 - Prob. 10BSCCh. 3.3 - Prob. 11BSCCh. 3.3 - Prob. 12BSCCh. 3.3 - Comparing Values. In Exercises 13-16, use z scores...Ch. 3.3 - Comparing Values. In Exercises 13-16, use z scores...Ch. 3.3 - Prob. 15BSCCh. 3.3 - Prob. 16BSCCh. 3.3 - Prob. 17BSCCh. 3.3 - Prob. 18BSCCh. 3.3 - Percentiles. In Exercises 1720, use the following...Ch. 3.3 - Prob. 20BSCCh. 3.3 - Prob. 21BSCCh. 3.3 - In Exercises 2128, use the same list of Sprint...Ch. 3.3 - In Exercises 2128, use the same list of Sprint...Ch. 3.3 - Prob. 24BSCCh. 3.3 - Prob. 25BSCCh. 3.3 - Prob. 26BSCCh. 3.3 - Prob. 27BSCCh. 3.3 - Prob. 28BSCCh. 3.3 - Boxplots. In Exercises 2932, use the given data to...Ch. 3.3 - Boxplots. In Exercises 2932, use the given data to...Ch. 3.3 - Prob. 31BSCCh. 3.3 - Prob. 32BSCCh. 3.3 - Boxplots from Large Data Sets in Appendix B. In...Ch. 3.3 - Prob. 34BSCCh. 3.3 - Boxplots from Large Data Sets in Appendix B. In...Ch. 3.3 - Prob. 36BSCCh. 3.3 - Prob. 37BBCh. 3 - Prob. 1CQQCh. 3 - Sleep Median What is the median of the sample...Ch. 3 - Prob. 3CQQCh. 3 - Prob. 4CQQCh. 3 - Prob. 5CQQCh. 3 - Prob. 6CQQCh. 3 - Prob. 7CQQCh. 3 - Prob. 8CQQCh. 3 - Prob. 9CQQCh. 3 - Prob. 10CQQCh. 3 - Prob. 1RECh. 3 - Prob. 2RECh. 3 - Prob. 3RECh. 3 - Prob. 4RECh. 3 - Prob. 5RECh. 3 - Prob. 6RECh. 3 - Prob. 7RECh. 3 - Prob. 8RECh. 3 - Prob. 1CRECh. 3 - Prob. 2CRECh. 3 - Prob. 3CRECh. 3 - Prob. 4CRECh. 3 - Prob. 5CRECh. 3 - Normal Distribution Examine the distribution shown...Ch. 3 - Words Spoken by Men and Women Refer to Data Set 24...Ch. 3 - Prob. 1FDD
Knowledge Booster


Learn more about
Need a deep-dive on the concept behind this application? Look no further. Learn more about this topic, statistics and related others by exploring similar questions and additional content below.Similar questions
- In Exercises 29–32, identify the level of measurement of the data as nominal, ordinal, interval, or ratio. Also, explain what is wrong with the given calculation. Temperatures As this exercise is being written, it is 80°F at the author’s home and it is 40°F in Auckland, New Zealand, so it is twice as warm at the author’s home as it is in Auckland, New Zealand.arrow_forwardA recent survey identified the top accounting firms within 10 geographical regions across country X. The top 2 regions reported a combined growth of 19% and 18%. A characteristic description of the accounting firms in these two regions includer the number of partners in the firms. Attached below is a sample of the number of partners for 20 firms for each region. Complete (a) through (c) below. E Click the icon to view the accounting firms data. a. At the 0.05 level of significance when pooling the variances, is there evidence of a difference between the two regions' accounting firms with respect to the mean number of partners? Let u, be the mean number of partners for the highest growth region and Ha be the mean number of partners for the second highest growth region. Determine the hypotheses. Choose the correct answer below. O A. Ho: H1 = H2 H1: H1 # H2 O B. Ho: H1242 H,: H1 H2 O D. Ho: H1 # H2 H1: H1 = 42 - X Accounting firms data Number of partners for 20 firms in the region with…arrow_forwardA survey of 100 students are taken. 32 Yes and 68 no. Find the point estimate of p and 96% CI.arrow_forward
arrow_back_ios
arrow_forward_ios
Recommended textbooks for you
 Glencoe Algebra 1, Student Edition, 9780079039897...AlgebraISBN:9780079039897Author:CarterPublisher:McGraw Hill
 Big Ideas Math A Bridge To Success Algebra 1: Stu...AlgebraISBN:9781680331141Author:HOUGHTON MIFFLIN HARCOURTPublisher:Houghton Mifflin Harcourt
 Holt Mcdougal Larson Pre-algebra: Student Edition...AlgebraISBN:9780547587776Author:HOLT MCDOUGALPublisher:HOLT MCDOUGAL
Glencoe Algebra 1, Student Edition, 9780079039897...
Algebra
ISBN:9780079039897
Author:Carter
Publisher:McGraw Hill
Big Ideas Math A Bridge To Success Algebra 1: Stu...
Algebra
ISBN:9781680331141
Author:HOUGHTON MIFFLIN HARCOURT
Publisher:Houghton Mifflin Harcourt
Holt Mcdougal Larson Pre-algebra: Student Edition...
Algebra
ISBN:9780547587776
Author:HOLT MCDOUGAL
Publisher:HOLT MCDOUGAL
The Shape of Data: Distributions: Crash Course Statistics #7; Author: CrashCourse;https://www.youtube.com/watch?v=bPFNxD3Yg6U;License: Standard YouTube License, CC-BY
Shape, Center, and Spread - Module 20.2 (Part 1); Author: Mrmathblog;https://www.youtube.com/watch?v=COaid7O_Gag;License: Standard YouTube License, CC-BY
Shape, Center and Spread; Author: Emily Murdock;https://www.youtube.com/watch?v=_YyW0DSCzpM;License: Standard Youtube License