
Concept explainers
Videos
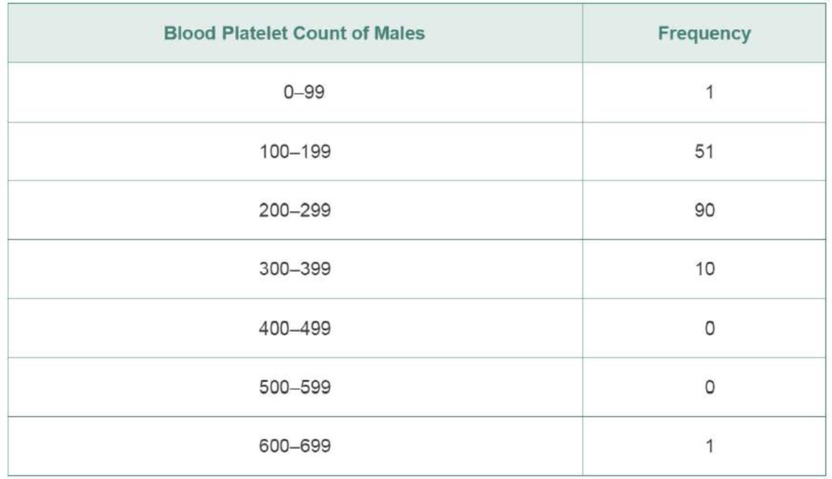
Finding Standard Deviation from a Frequency Distribution. In Exercises 37–40, refer to the frequency distribution in the given exercise and find the standard deviation by using the formula below, where x represents the class midpoint, f represents the class frequency, and n represents the total number of sample values. Also, compare the computed standard deviations to these standard deviations obtained by using Formula 3-4 with the original list of data values: (Exercise 37) 11.5 years; (Exercise 3) 8.9 years; (Exercise 39) 59.5; (Exercise 40) 65.4.
Standard deviation for frequency distribution
Instructions for Exercises 37–40 are on the bottom of the preceding page.
39. 
Want to see the full answer?
Check out a sample textbook solution
Chapter 3 Solutions
Elementary Statistics Using The Ti-83/84 Plus Calculator, Books A La Carte Edition (5th Edition)


- In Exercises 11–18, use the indicated data to construct the frequency distribution. (The data for Exercises 13–16 can be downloaded at TriolaStats.com.) Burger King Lunch Service Times Refer to Data Set 25 “Fast Food” and use the drive-through service times for Burger King lunches. Begin with a lower class limit of 70 seconds and use a class width of 40 seconds.arrow_forwardEvery year, the students at a school are given a musical aptitude test that rates them from 0 (no musical aptitude) to 5 (high musical aptitude). This year's results were: Aptitude Score 0 1 2 3 4 5 Frequency 7 3 2 2 6 4 The average (mean) aptitude score:arrow_forwardFor Exercises 7–10, (a) compute the arithmetic mean and (b) indicate whether it is a 7. There are 10 salespeople employed by Midtown Ford. The number of new cars statistic or a parameter. Sold last month by the respective salespeople were: 15, 23, 4, 19, 18, 10, 10, 0 28, 19. Dve order company counted the number of incoming calls per day to the compa- Ivs toll-free number during the first 7 days in May: 14, 24, 19, 31, 36, 26, 17.arrow_forward
- Every year, the students at a school are given a musical aptitude test that rates them from 0 (no musical aptitude) to 5 (high musical aptitude). This year's results were: Aptitude Score 0 1 2 3 4 5 Frequency 2 2 3 2 2 3 The average (mean) aptitude score: The median aptitude score: Show your workarrow_forwardEvery year, the students at a school are given a musical aptitude test that rates them from 0 (no musical aptitude) to 5 (high musical aptitude). This year's results were: Aptitude Score Frequency 0 0 1 3 2 1 3 3 4 6 5 3 The mean (¯xx¯) aptitude score: (Please show your answer to 1 decimal place.)The median aptitude score: The mode aptitude score:arrow_forwardEvery year, the students at a school are given a musical aptitude test that rates them from 0 (no musical aptitude) to 5 (high musical aptitude). This year's results were: Aptitude Score 1 2 3 4 5 Frequency 1 4 5 3 The average (mean) aptitude score: Enter an integer or decimal number [more.] The median aptitude score:arrow_forward
- Every year, the students at a school are given a musical aptitude test that rates them from 0 (no musical aptitude) to 5 (high musical aptitude). This year's results were: Aptitude Score 0 1 2 3 4 5 Frequency 3 5 5 1 6 5 The average (mean) aptitude score is: (rounded to two decimal points)The median aptitude score:arrow_forwardTest scores overall have a mean of 1017 and s = 207. If a college wants to admit only the top 30% of those, what score would they use as the minimum required? (Round to the appropriate whole number score). The would admit scores of ___________and above.arrow_forwardEvery year, the students at a school are given a musical aptitude test that rates them from 0 (no musical aptitude) to 5 (high musical aptitude). This year's results were: Aptitude Score01 23 4 5 5 3 Frequency 3 4 The average (mean) aptitude score: The median aptitude score: 2. 3.arrow_forward
- frequency distribution method is used to organize the data when data is nominal and ordinal. a. Categorical frequency distribution b. Grouped frequency distribution c. Ungrouped frequency distribution d. All Optionsarrow_forwardEvery year, the students at a school are given a musical aptitude test that rates them from 0 (no musical aptitude) to 5 (high musical aptitude). This year's results were: Aptitude Score Frequency 1 3 4 3 1 7 3 3 1 The mean aptitude score: The median aptitude score:arrow_forwardConstructing Frequency Distributions. In Exercises Il-18, use the indicated data to construct the frequency distribution. (The data for Exercises 13–16 can be downloaded at TriolaStats.com.) 11. Old Faithful Listed below are sorted duration times (seconds) of eruptions of the Old Faithful geyser in Yellowstone National Park. Use these times to construct a frequency distribu- tion. Use a class width of 25 seconds and begin with a lower class limit of 125 seconds. 125-203 205 221 225-229 233 233 235 236 236 237 238 238 239 240 240 240240 241241 242 242 242 243 243 244 245 245 245 245 246 246 248 248 248 249 249 250 251 252 253 253 255 255 256 2S7 258 262 264 12. Tornadoes Listed below are the F-scale intensities of recent tornadoes in the United States. Construct a frequency distribution. Do the intensities appear to have a normal distribution? 0 4 0 0 111 00 0 1 2 0 11 010 F Ill0 0111 10 010 0 1 0 0 1I1 30 0 0 0 0 3 000 2 0 13. Burger King Lunch Service Times Refer to Data Set 25 "Fast…arrow_forward
 Glencoe Algebra 1, Student Edition, 9780079039897...AlgebraISBN:9780079039897Author:CarterPublisher:McGraw Hill