
Videos
To plot: The graph for given system of inequalities and solve
Explanation of Solution
Given information :
The following system of inequalities:
Calculation :
Let the inequalities are:
Use maple to plot the graph of the above equation.
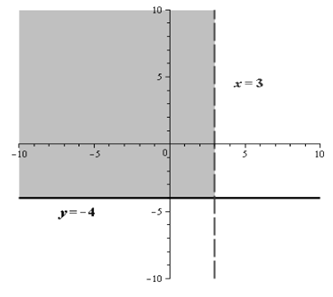
To test the solution by substituting
First, substitute the points
This is true, means 0 is less than 3.
Now, substitute the points
This is true, means 0 is greater than −4.
Hence, the graph of the inequalities overlap, both equations go towards origin and overlap. The solution is in grey color.
Chapter 3 Solutions
Glencoe Algebra 2 Student Edition C2014
Additional Math Textbook Solutions
PREALGEBRA
College Algebra (7th Edition)
College Algebra
Linear Algebra and Its Applications (5th Edition)
University Calculus: Early Transcendentals (4th Edition)


 Algebra and Trigonometry (6th Edition)AlgebraISBN:9780134463216Author:Robert F. BlitzerPublisher:PEARSON
 Contemporary Abstract AlgebraAlgebraISBN:9781305657960Author:Joseph GallianPublisher:Cengage Learning
 Linear Algebra: A Modern IntroductionAlgebraISBN:9781285463247Author:David PoolePublisher:Cengage Learning
 Algebra And Trigonometry (11th Edition)AlgebraISBN:9780135163078Author:Michael SullivanPublisher:PEARSON
 Introduction to Linear Algebra, Fifth EditionAlgebraISBN:9780980232776Author:Gilbert StrangPublisher:Wellesley-Cambridge Press
 College Algebra (Collegiate Math)AlgebraISBN:9780077836344Author:Julie Miller, Donna GerkenPublisher:McGraw-Hill Education