
Videos
To graph: Graph the inequality,
Explanation of Solution
Given information:
Method used: Graph the inequality using x and y intercepts method.
Calculation:
Firstly consider the given inequality as equation.
Find x and y intercepts.
X -intercept when y is 0:
Divide both sides by 3.
X -intercept is (2,0)
Find y -intercept when x is 0.
Divide both sides by -1.
Y -intercept is at (0,-6)
Represent these points on xy plane and join the points then make it as dotted line because our inequality sign has no equal sign with it.
The dotted line divides the xy -plane into two regions.
Now, find the solution region using test points.
Use (0,0)
Plug in this test point into the inequality
The inequality is false. So, the region where the (0,0) does not lie is the solution region. Shade that region
Graph:
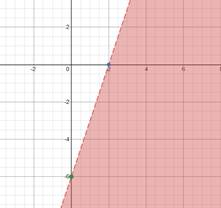
Interpretation: The graph of the given inequality is a dotted line and solution region is below that dotted line.
Chapter 3 Solutions
Glencoe Algebra 2 Student Edition C2014
Additional Math Textbook Solutions
College Algebra (7th Edition)
Linear Algebra and Its Applications (5th Edition)
College Algebra
Calculus: Early Transcendentals (3rd Edition)


 Algebra and Trigonometry (6th Edition)AlgebraISBN:9780134463216Author:Robert F. BlitzerPublisher:PEARSON
 Contemporary Abstract AlgebraAlgebraISBN:9781305657960Author:Joseph GallianPublisher:Cengage Learning
 Linear Algebra: A Modern IntroductionAlgebraISBN:9781285463247Author:David PoolePublisher:Cengage Learning
 Algebra And Trigonometry (11th Edition)AlgebraISBN:9780135163078Author:Michael SullivanPublisher:PEARSON
 Introduction to Linear Algebra, Fifth EditionAlgebraISBN:9780980232776Author:Gilbert StrangPublisher:Wellesley-Cambridge Press
 College Algebra (Collegiate Math)AlgebraISBN:9780077836344Author:Julie Miller, Donna GerkenPublisher:McGraw-Hill Education