
Videos
(a)
To explain the reason due to which the height of the curve is equal to 1.
(a)
Explanation of Solution
Given:
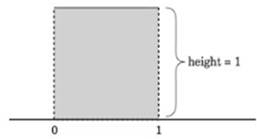
The height of the given graph is 1, because it is equally distributed for the
(b)
To calculate the
(b)
Answer to Problem 3.7E
Mean = 0.5
Explanation of Solution
Given:
Formula used:
Calculation:
(c)
To calculate the mean of the density curve.
(c)
Answer to Problem 3.7E
Explanation of Solution
Calculation:
(d)
To calculate the proportion that falls between 0 and 0.4.
(d)
Answer to Problem 3.7E
0.4
Explanation of Solution
Calculation:
Chapter 3 Solutions
Statistics Through Applications
Additional Math Textbook Solutions
Fundamentals of Statistics (5th Edition)
Statistics for Psychology
Elementary Statistics: Picturing the World (6th Edition)
Basic Business Statistics, Student Value Edition (13th Edition)
Essentials of Statistics (6th Edition)
Introductory Statistics (2nd Edition)


 MATLAB: An Introduction with ApplicationsStatisticsISBN:9781119256830Author:Amos GilatPublisher:John Wiley & Sons Inc
 Probability and Statistics for Engineering and th...StatisticsISBN:9781305251809Author:Jay L. DevorePublisher:Cengage Learning
 Statistics for The Behavioral Sciences (MindTap C...StatisticsISBN:9781305504912Author:Frederick J Gravetter, Larry B. WallnauPublisher:Cengage Learning
 Elementary Statistics: Picturing the World (7th E...StatisticsISBN:9780134683416Author:Ron Larson, Betsy FarberPublisher:PEARSON
 The Basic Practice of StatisticsStatisticsISBN:9781319042578Author:David S. Moore, William I. Notz, Michael A. FlignerPublisher:W. H. Freeman
 Introduction to the Practice of StatisticsStatisticsISBN:9781319013387Author:David S. Moore, George P. McCabe, Bruce A. CraigPublisher:W. H. Freeman