
Concept explainers
Videos
(a)
To explain the each graph and locate the
(a)
Explanation of Solution
Given:
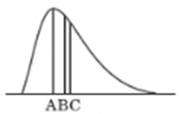
The shape of the given distribution is right skewed and in the right skewed curve the mean is greater than the median and median is greater than
(b)
To explain the each graph and locate the mean and median of the graph.
(b)
Explanation of Solution
Given:
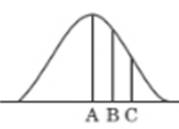
The shape of the given distribution is
(c)
To explain the each graph and locate the mean and median of the graph.
(c)
Explanation of Solution
Given:
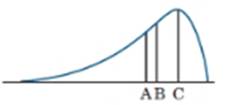
The shape of the given distribution is left skewed and in the left skewed data distribution, the mean is smaller than median and median is smaller than mode, Mean < Median < Mode.
Therefore, the mean is A, median is B and mode is C.
Chapter 3 Solutions
Statistics Through Applications
Additional Math Textbook Solutions
Introductory Statistics
Essentials of Statistics, Books a la Carte Edition (5th Edition)
Intro Stats, Books a la Carte Edition (5th Edition)
Statistics for Psychology
Elementary Statistics (13th Edition)


 MATLAB: An Introduction with ApplicationsStatisticsISBN:9781119256830Author:Amos GilatPublisher:John Wiley & Sons Inc
 Probability and Statistics for Engineering and th...StatisticsISBN:9781305251809Author:Jay L. DevorePublisher:Cengage Learning
 Statistics for The Behavioral Sciences (MindTap C...StatisticsISBN:9781305504912Author:Frederick J Gravetter, Larry B. WallnauPublisher:Cengage Learning
 Elementary Statistics: Picturing the World (7th E...StatisticsISBN:9780134683416Author:Ron Larson, Betsy FarberPublisher:PEARSON
 The Basic Practice of StatisticsStatisticsISBN:9781319042578Author:David S. Moore, William I. Notz, Michael A. FlignerPublisher:W. H. Freeman
 Introduction to the Practice of StatisticsStatisticsISBN:9781319013387Author:David S. Moore, George P. McCabe, Bruce A. CraigPublisher:W. H. Freeman