
Concept explainers
Videos
(a)
To construct: the histogram and the distribution of coli form appear to be approximately normal.
(a)
Explanation of Solution
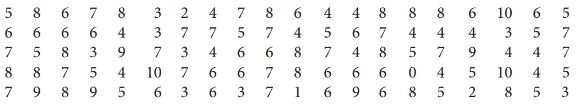
Given:

Graph:
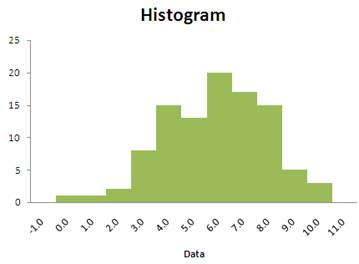
The distribution is looking to be a normal because the histogram has a clock shape. First
(b)
To Calculate: the
(b)
Answer to Problem 3.52RE
Mean = 5.88 and
Standard deviation = 4.11
Explanation of Solution
Given:
Calculation:
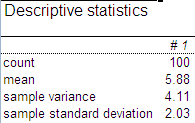
Mean is 5.88 and standard deviation is 4.11 which is looking forth. The first quartile and third quartile are 4 and 7 respectively.
(c)
To Calculate: the percent of the distribution fall within one, two and three standard deviation of the mean.
(c)
Explanation of Solution
Graph:
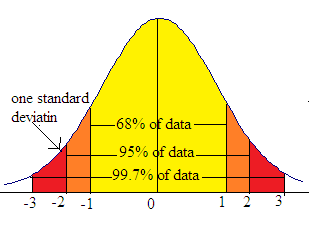
68% of the data lies within one standard deviations of the mean, 95% of the data lies within two standard deviation of the mean and 99.7% of the data lies within three standard deviation of the mean which into the diagram
Chapter 3 Solutions
Statistics Through Applications
Additional Math Textbook Solutions
Introductory Statistics (10th Edition)
Statistics for Business and Economics (13th Edition)
Introductory Statistics (2nd Edition)
Elementary Statistics Using Excel (6th Edition)
Fundamentals of Statistics (5th Edition)
Elementary Statistics: Picturing the World (7th Edition)


 MATLAB: An Introduction with ApplicationsStatisticsISBN:9781119256830Author:Amos GilatPublisher:John Wiley & Sons Inc
 Probability and Statistics for Engineering and th...StatisticsISBN:9781305251809Author:Jay L. DevorePublisher:Cengage Learning
 Statistics for The Behavioral Sciences (MindTap C...StatisticsISBN:9781305504912Author:Frederick J Gravetter, Larry B. WallnauPublisher:Cengage Learning
 Elementary Statistics: Picturing the World (7th E...StatisticsISBN:9780134683416Author:Ron Larson, Betsy FarberPublisher:PEARSON
 The Basic Practice of StatisticsStatisticsISBN:9781319042578Author:David S. Moore, William I. Notz, Michael A. FlignerPublisher:W. H. Freeman
 Introduction to the Practice of StatisticsStatisticsISBN:9781319013387Author:David S. Moore, George P. McCabe, Bruce A. CraigPublisher:W. H. Freeman