
Operations Management: Processes and Supply Chains (12th Edition) (What's New in Operations Management)
12th Edition
ISBN: 9780134741062
Author: Lee J. Krajewski, Manoj K. Malhotra, Larry P. Ritzman
Publisher: PEARSON
expand_more
expand_more
format_list_bulleted
Concept explainers
Question
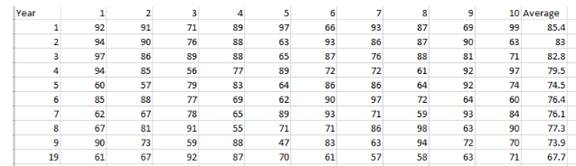
Chapter 3, Problem 5P
Summary Introduction
To calculate:
Use these data to estimate the center and standard deviation for this distribution.
Expert Solution & Answer
Want to see the full answer?
Check out a sample textbook solution
Students have asked these similar questions
Based off the provided image, do the measuring scales exhibit sufficient convergent and discriminant validity? Explain why or why not.
28. Which two of the following are perspectives from the balanced scorecard performance measurement model for achieving an organization's strategic objectives?
Innovation and learning
Firm infrastructure
Operations
Internal business processes
Technology development
29. Which of the following is the best method for visualizing data about trends over time for several data sets on a single chart?
A clustered bar chart
A component bar chart
A line chart
A pie chart
South Africa Airways would like to monitor its airline’s performance. Each week for the past 20 weeks, they checked each week a random sample of 100 flight arrivals for “one-time” performance. The table that follows contains the number of flights that did not meet South Africa Airways definition of “one time”:
Week
Late flights
1
2
2
4
3
10
4
4
5
1
6
1
7
13
8
9
9
11
10
0
11
3
12
4
13
2
14
2
15
8
16
2
17
3
18
7
19
3
20
2
Which control chart is appropriate to analyze the above data?
Justify your answer
Chapter 3 Solutions
Operations Management: Processes and Supply Chains (12th Edition) (What's New in Operations Management)
Ch. 3 - Should a very pricey handcrafted object of beauty...Ch. 3 - Prob. 2DQCh. 3 - Prob. 3DQCh. 3 - Prob. 1PCh. 3 - Prob. 2PCh. 3 - Prob. 3PCh. 3 - Prob. 4PCh. 3 - Prob. 5PCh. 3 - Prob. 6PCh. 3 - Prob. 7P
Ch. 3 - Prob. 8PCh. 3 - Prob. 9PCh. 3 - Prob. 10PCh. 3 - Prob. 11PCh. 3 - Prob. 12PCh. 3 - Prob. 13PCh. 3 - Prob. 14PCh. 3 - Prob. 15PCh. 3 - Prob. 16PCh. 3 - Prob. 17PCh. 3 - Prob. 18PCh. 3 - Prob. 19PCh. 3 - Prob. 20PCh. 3 - Prob. 21PCh. 3 - Prob. 26PCh. 3 - Prob. 27PCh. 3 - Prob. 28PCh. 3 - Prob. 29PCh. 3 - Prob. 31PCh. 3 - Prob. 1AMECh. 3 - Prob. 2AMECh. 3 - Prob. 3AMECh. 3 - Prob. 4AMECh. 3 - Prob. 5AMECh. 3 - Prob. 1VCCh. 3 - Prob. 2VC
Knowledge Booster


Learn more about
Need a deep-dive on the concept behind this application? Look no further. Learn more about this topic, operations-management and related others by exploring similar questions and additional content below.Similar questions
- South Africa Airways would like to monitor its airline’s performance. Each week for the past 20 weeks, they checked each week a random sample of 100 flight arrivals for “one-time” performance. The table that follows contains the number of flights that did not meet South Africa Airways definition of “one time”: Week Late flights 1 2 2 4 3 10 4 4 5 1 6 1 7 13 8 9 9 11 10 0 11 3 12 4 13 2 14 2 15 8 16 2 17 3 18 7 19 3 20 2 Calculate the upper and lower control limits for this chart.arrow_forwardPatients at North Shore Family Practice are required to fill out a questionnaire that gives the doctor an overall idea of each patient’s health. The first question is: “In general, what is the quality of your health?” The patient chooses Excellent, Good, Fair, or Poor. A portion of the 150 responses is as follows: Response Quality 1 Fair 2 Good ⋮ ⋮ 150 Good picture Click here for the Excel Data File a-1. Construct the frequency distribution that summarizes the results from the questionnaire. a-2. What is the most common response to the questionnaire? multiple choice 1 Poor Fair Good Excellent b. Which of the above figures best represents the bar chart for Quality?arrow_forwardWhich of the following is not a lead indicator used in balanced scorecards? Multiple Choice Quality Customer loyalty Innovation and growth Employee capabilities profit marginarrow_forward
- 1.The reported unemployment is 5.5% of the population. What measurement scale is used to measure unemployment? Interval Nominal Ordinal Ratio 2.Which one of the following is NOT an example of discrete data? Number of employees reporting in sick Number of households watching the Home Shopping Network Number of miles between New York City and Chicago Number of members of the Denver Lions Clubarrow_forwardcan you help me answer this questions: 1-A moving average is the average of the observations in the past few periods, where the number of terms in the average is the span. True False 2- All nominal data may be treated as ordinal data. False True 3 - Phone numbers, Social Security numbers, and zip codes are typically treated as numerical variables. True False 4 - Correlation is useful only for: a.measuring the strength of a linear relationship. b.conveying the same information in a simpler format than a scatterplot. c.measuring the strength of a nonlinear relationship. d.assessing the weakness of a linear relationship. 5 - Which of the following will give the value for the third quartile? a. QUARTILE.INC(array, 0.25) b.QUARTILE.INC(array, 0.75) c. PERCENTILE.INC(array, 0.75) d.DECILE.INC(array, 0.30) 6 - _______ sampling applies to populations that are divided into natural subsets and allocates the appropriate proportion of samples to each subset.…arrow_forwardThe IRS is concerned with improving the accuracy of tax information given by its representatives over the telephone. Previous studies involved asking a set of 25 questions of a large number of IRS telephone representatives to determine the proportion of correct responses. Historically, the averageproportion of correct responses has been 72 percent. Recently, IRS representatives have been receiving more training. On April 26, the set of 25 tax questions were again asked of 20 randomly selected IRS telephone representatives. The numbers of correct answers were 18, 16, 19, 21, 20, 16,21, 16, 17, 10, 25, 18, 25, 16, 20, 15, 23, 19, 21, and 19. a. What are the upper and lower control limits for the appropriate p-chart for the IRS? Use z = 3. b. Is the tax information process in statistical control?arrow_forward
- COQ Histogram; Spreadsheet Application Genova Company classifies its costs of quality intofour categories. The costs of quality (COQ) as a percentage of cost of goods sold for the last threeyears are as follows:[LO 17-1, 17-5][LO 17-5]2019 2020 2021Prevention costs 1.00% 4.00% 2.00%Appraisal costs 3.00 2.50 1.50Internal failure costs 27.00 23.00 14.00External failure costs 31.00 18.00 12.00Required1. Use a spreadsheet to prepare a histogram that shows the costs of quality (COQ) trends as a percentageof cost of goods sold.2. Comment on the trends in cost of quality (COQ) over the 3-year period from 2019 to 2021.3. Based on the observed trends, what total cost of quality can the company expect in 2022? Explain.arrow_forwardBill Kime's bowling ball factory makes bowling balls of adult size and weight only. The standard deviation in the weight of a bowling ball produced at the factory is known to be 0.39 pounds. Each day for 24 days, the average weight, in pounds, of 9 of the bowling balls produced that day has been assessed as follows Day 1 2 3 4 5 6 Average (lb) 9.9 9.9 10.1 10.1 99 99 Day 7 8 9 10 11 12 Average (lb) Day Average (b) 13 14 15 16 17 18 10.1 10.0 10.0 10.1 10.1 10.0 9.9 10.1 10.1 10.0 10.1 10.1 Day 19 20 21 22 23 24 Average (lb) 99 10.0 10.1 9.9 10.0 10.0 a) Establish a control chart for monitoring the average weights of the bowling balls in which the upper and lower control limits are each two standard deviations from the mean What are the values of the control limits? Upper Control Limit (UCL)=b (Round your response to two decimal places)arrow_forward1. Statistical process control, hypothesis testing, and control charts Consumers value prompt service when they order takeout or delivered pizza, and pizza restaurants compete for customers by making time promises. Papa John's, for instance, offers a 10-minute takeout guarantee. Domino's advertises a 30-minute delivery time. Suppose that the quality control manager at a nationwide pizza chain defines this production variable: An order is processed on time or late. Every night, a random sample of pizza orders is selected, and data are collected on the production variable for each order in the sample. To detect a change in the number of orders that are late, the quality control manager uses Based on the control chart, the quality control manager decides that the variation in output is due to assignable causes. Consequently, the manager concludes that the production process is ; it is Statistical procedures for process control use a hypothesis-testing framework. The null and alternative…arrow_forward
- please help with this question using the sensitivity report and explain how you got the answerarrow_forwardThe following data was recorded while observing the increase in the number of butterflies in two different ponds, Pond A and Pond B. Number of Butterflies Present Over 5 Years Year Pond A Pond B 0 50 65 85 1 2 3 4 5 100 O 110 121 133 146 161 110 143 186 What is the rate of growth, r, for each pond and which pond has the fastest average rate of growth over the five years? TA = 1.1, TB = 1.3, mg = 3.72 butterflies/yr TA=0.9, TB=0.8, mg = 3.72 butterflies/yr TA=0.9, TB=0.8, mg=27.2 butterflies/yr TA = 1.1, TB = 1.3, mg=27.2 butterflies/yrarrow_forwardWhat does the z-score of a data point tell us? Group of answer choices How many standard deviation a number is from the mean. How many IQR the max and min are from the mean. How far a number is from the mean. How many IQR a number is from the mean.arrow_forward
arrow_back_ios
SEE MORE QUESTIONS
arrow_forward_ios
Recommended textbooks for you
 Practical Management ScienceOperations ManagementISBN:9781337406659Author:WINSTON, Wayne L.Publisher:Cengage,
 Operations ManagementOperations ManagementISBN:9781259667473Author:William J StevensonPublisher:McGraw-Hill Education
 Operations and Supply Chain Management (Mcgraw-hi...Operations ManagementISBN:9781259666100Author:F. Robert Jacobs, Richard B ChasePublisher:McGraw-Hill Education
 Purchasing and Supply Chain ManagementOperations ManagementISBN:9781285869681Author:Robert M. Monczka, Robert B. Handfield, Larry C. Giunipero, James L. PattersonPublisher:Cengage Learning
 Production and Operations Analysis, Seventh Editi...Operations ManagementISBN:9781478623069Author:Steven Nahmias, Tava Lennon OlsenPublisher:Waveland Press, Inc.
Practical Management Science
Operations Management
ISBN:9781337406659
Author:WINSTON, Wayne L.
Publisher:Cengage,
Operations Management
Operations Management
ISBN:9781259667473
Author:William J Stevenson
Publisher:McGraw-Hill Education
Operations and Supply Chain Management (Mcgraw-hi...
Operations Management
ISBN:9781259666100
Author:F. Robert Jacobs, Richard B Chase
Publisher:McGraw-Hill Education
Purchasing and Supply Chain Management
Operations Management
ISBN:9781285869681
Author:Robert M. Monczka, Robert B. Handfield, Larry C. Giunipero, James L. Patterson
Publisher:Cengage Learning
Production and Operations Analysis, Seventh Editi...
Operations Management
ISBN:9781478623069
Author:Steven Nahmias, Tava Lennon Olsen
Publisher:Waveland Press, Inc.