
Concept explainers
Videos
(a)
To find: that these percentages are of column percentage or row percentages.
(a)
Explanation of Solution
Given:
| Normal | Overweight | Obese | |
| Inactive | 23.8 | 26 | 35.6 |
| Irregularly active | 27.8 | 28.7 | 28.1 |
| Regular, not intense | 31.6 | 31.1 | 27.2 |
| Regular, intense | 16.8 | 14.2 | 9.1 |
Calculation:
Finding the 2-way table of percentages on Obesity basing on different level of physical activities and BMI along with totals
| Normal | Overweight | Obese | total % | |
| Inactive | 23.8 | 26 | 35.6 | 85.4 |
| Irregularly active | 27.8 | 28.7 | 28.1 | 84.6 |
| Regular, not intense | 31.6 | 31.1 | 27.2 | 170 |
| Regular, intense | 16.8 | 14.2 | 9.1 | 40.1 |
| Total % | 100 | 100 | 100 | 300 |
By seeing the table, it is observed that column percentages are 100% but row percentages and total percentages are not 100% therefore this is not table percentages.
(b)
To construct: the graphical displays to represent different percentage of physical activities.
(b)
Explanation of Solution
Given:
| Normal | Overweight | Obese | |
| Inactive | 23.8 | 26 | 35.6 |
| Irregularly active | 27.8 | 28.7 | 28.1 |
| Regular, not intense | 31.6 | 31.1 | 27.2 |
| Regular, intense | 16.8 | 14.2 | 9.1 |
Graph:
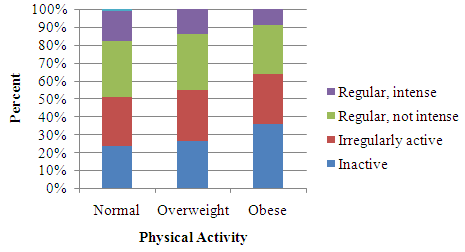
This is the graphical displays to represent different percentage of physical activities like normal, overweight and obese.
(c)
To Explain: these data to prove the lack of exercise causes obesity.
(c)
Answer to Problem 32E
Yes
Explanation of Solution
Given:
| Normal | Overweight | Obese | |
| Inactive | 23.8 | 26 | 35.6 |
| Irregularly active | 27.8 | 28.7 | 28.1 |
| Regular, not intense | 31.6 | 31.1 | 27.2 |
| Regular, intense | 16.8 | 14.2 | 9.1 |
Yes, it is observed from the graph, that the BMI percentage are high for people with less physical activity, and the people who don’t do exercises have too much chance of obesity and also people who are not active have also the possibility of obesity
Chapter 3 Solutions
Stats: Modeling the World Nasta Edition Grades 9-12
Additional Math Textbook Solutions
Basic Business Statistics, Student Value Edition
Pre-Algebra Student Edition
Introductory Statistics
A First Course in Probability (10th Edition)
College Algebra (7th Edition)
Calculus: Early Transcendentals (2nd Edition)


- please solve this problem step by step with clear explanationarrow_forwardplease solve this problem step by step with clear explanationarrow_forwardSaved Tabs T Home < > 110 troy.instructure.com Apple Bing G Google y! Yahoo ↓ >>> >>> Troy University - Welcom... X Quiz: HYPOTHESIS TEST... questions. Unlike the other exams and quizzes, you only get ONE attempt. However, it is not timed. I strongly recommend attempting the practice assignment (not graded) first to understand what is expected. D Question 1 1 pts The mean IQ for the U.S. is 100 with a standard deviation of 15. A Troy statistics professor thinks Troy students are smarter than average, so he randomly samples 10 students and records the following IQ data to test his hypothesis. (Use the following data for all subsequent questions.) What is the mean for the following data? IQ: 95 100 105 110 115 100 105 110 105 105 115 105 can't be determined 106 110arrow_forward
- Please help me with the wrong answer. Thank you!arrow_forwardA researcher records the repair cost for 2222 randomly selected dryers. A sample mean of $84.67$84.67 and standard deviation of $18.09$18.09 are subsequently computed. Determine the 98%98% confidence interval for the mean repair cost for the dryers. Assume the population is approximately normal.arrow_forwardUse the given data to find the equation of the regression line. Examine the scatterplot and identify a characteristic of the data that is ignored by the regression line. K X 11 7 y 7.5 6.8 12 13.08 9 11 13 5 4 7.07 7.71 9.27 5.94 5.62 13 8.36 7 6 6.52 5.47 D Create a scatterplot of the data. Choose the correct graph below. O A. 20 Ay 22565 15 10 0 5 10 15 20 25 OB. 25 204 15 10- 5 0 0 5 10 15 20 25 E ง Find the equation of the regression line. y= 5.76+ (Round the y-intercept two decimal places as needed. Round the slope to three decimal places as needed.) Identify a characteristic of the data that is ignored by the regression line. A. The data has a pattern that is not a straight line. OB. There is no characteristic of the data that is ignored by the regression line. OC. There is an influential point that strongly affects the graph of the regression line. OD. There is no trend in the data. C. 25 20 15 10 5 0 5 10 15 20 25 2 OD. 25 20 15 10 5 0 5 10 15 20 25 Garrow_forward
 MATLAB: An Introduction with ApplicationsStatisticsISBN:9781119256830Author:Amos GilatPublisher:John Wiley & Sons Inc
 Probability and Statistics for Engineering and th...StatisticsISBN:9781305251809Author:Jay L. DevorePublisher:Cengage Learning
 Statistics for The Behavioral Sciences (MindTap C...StatisticsISBN:9781305504912Author:Frederick J Gravetter, Larry B. WallnauPublisher:Cengage Learning
 Elementary Statistics: Picturing the World (7th E...StatisticsISBN:9780134683416Author:Ron Larson, Betsy FarberPublisher:PEARSON
 The Basic Practice of StatisticsStatisticsISBN:9781319042578Author:David S. Moore, William I. Notz, Michael A. FlignerPublisher:W. H. Freeman
 Introduction to the Practice of StatisticsStatisticsISBN:9781319013387Author:David S. Moore, George P. McCabe, Bruce A. CraigPublisher:W. H. Freeman