
Concept explainers
Videos
(a)
To find: the percent of these mothers received inadequate medical care during the pregnancies.
(a)
Answer to Problem 30E
22.7%
Explanation of Solution
Given:
| Preterm (induced or cesarean) | Preterm (without procedures) | Term or post-term | Total | |
| Intensive | 18 | 15 | 28 | 61 |
| Adequate | 46 | 43 | 65 | 154 |
| Inadequate | 12 | 13 | 38 | 63 |
| Total | 76 | 71 | 131 | 278 |
Calculation:
From the table, it is observed that the total number of mothers is 278 and out of them 63 received inadequate medical care during their pregnancies.
Therefore, the percent of mother received inadequate medical care during their pregnancies is
Therefore, the percent of mothers who received inadequate medical care is 22.7%.
(b)
To find: the percent of all twin births were preterm.
(b)
Answer to Problem 30E
52.9%
Explanation of Solution
Given:
| Preterm (induced or cesarean) | Preterm (without procedures) | Term or post-term | Total | |
| Intensive | 18 | 15 | 28 | 61 |
| Adequate | 46 | 43 | 65 | 154 |
| Inadequate | 12 | 13 | 38 | 63 |
| Total | 76 | 71 | 131 | 278 |
Calculation:
From the table, it is observed that the total number of preterm twin births was 76+71=147 and total number of births was 278.
Therefore, the percent of all pre-term twin births is
Therefore, the percent of all pre-term twin births is 52.9%.
(c)
To find: the percent of the twin births were preterm.
(c)
Answer to Problem 30E
39.7%
Explanation of Solution
Given:
| Preterm (induced or cesarean) | Preterm (without procedures) | Term or post-term | Total | |
| Intensive | 18 | 15 | 28 | 61 |
| Adequate | 46 | 43 | 65 | 154 |
| Inadequate | 12 | 13 | 38 | 63 |
| Total | 76 | 71 | 131 | 278 |
Calculation:
Total number of the mothers who received inadequate medical care is 63. Out of them number of preterm twin births was 12+13=25.
Therefore, among the mothers who received inadequate medical care, percent of the twin births were preterm is
Therefore, the percent of pre-term twin births to mothers who received inadequate medical care is 39.7%.
(d)
To construct: an appropriate graph comparing the outcomes of the pregnancies.
(d)
Explanation of Solution
Given:
| Preterm (induced or cesarean) | Preterm (without procedures) | Term or post-term | Total | |
| Intensive | 18 | 15 | 28 | 61 |
| Adequate | 46 | 43 | 65 | 154 |
| Inadequate | 12 | 13 | 38 | 63 |
| Total | 76 | 71 | 131 | 278 |
Calculation:
Finding the conditional distribution of the level of prenatal care
| Twin Births | ||||
| Level of prenatal care | Preterm (induced or Caesarean) | Preterm (without procedures) | Term or Post- term | |
| intensive | 29.5% | 24.6% | 45.9% | |
| Adequate | 29.9% | 27.9% | 42.2% | |
| Inadequate | 19.0% | 20.6% | 60.3% |
Graph:
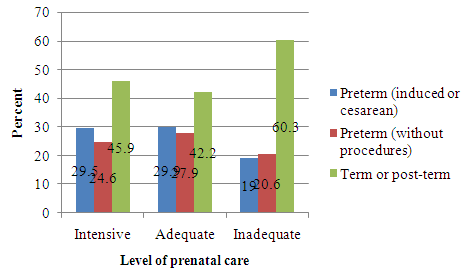
This is the required an appropriate graph comparing the outcomes of the pregnancies.
(e)
To Explain: the few sentences describing the association between these two variables.
(e)
Explanation of Solution
It is observed that, it looks that there is an association between these variables. If there is level of prenatal care is not adequate, post or term births are too much more than the preterm births in comparison of adequate or intensive care.
Chapter 3 Solutions
Stats: Modeling the World Nasta Edition Grades 9-12
Additional Math Textbook Solutions
Statistics for Business and Economics (13th Edition)
Statistics for Psychology
Basic Business Statistics, Student Value Edition
Introductory Statistics
Essentials of Statistics, Books a la Carte Edition (5th Edition)


 MATLAB: An Introduction with ApplicationsStatisticsISBN:9781119256830Author:Amos GilatPublisher:John Wiley & Sons Inc
 Probability and Statistics for Engineering and th...StatisticsISBN:9781305251809Author:Jay L. DevorePublisher:Cengage Learning
 Statistics for The Behavioral Sciences (MindTap C...StatisticsISBN:9781305504912Author:Frederick J Gravetter, Larry B. WallnauPublisher:Cengage Learning
 Elementary Statistics: Picturing the World (7th E...StatisticsISBN:9780134683416Author:Ron Larson, Betsy FarberPublisher:PEARSON
 The Basic Practice of StatisticsStatisticsISBN:9781319042578Author:David S. Moore, William I. Notz, Michael A. FlignerPublisher:W. H. Freeman
 Introduction to the Practice of StatisticsStatisticsISBN:9781319013387Author:David S. Moore, George P. McCabe, Bruce A. CraigPublisher:W. H. Freeman