
Fundamentals of Corporate Finance
11th Edition
ISBN: 9780077861704
Author: Stephen A. Ross Franco Modigliani Professor of Financial Economics Professor, Randolph W Westerfield Robert R. Dockson Deans Chair in Bus. Admin., Bradford D Jordan Professor
Publisher: McGraw-Hill Education
expand_more
expand_more
format_list_bulleted
Concept explainers
Videos
Textbook Question
Chapter 3, Problem 13QP
Just Dew It Corporation reports the following
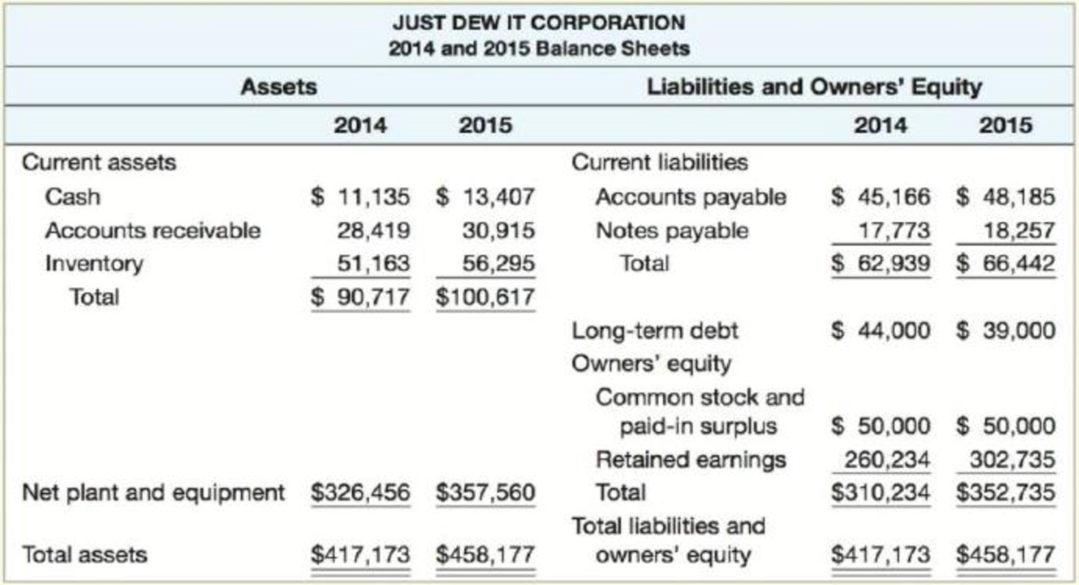
13. Preparing Standardized Financial Statements [LO1] Prepare the 2014 and 2015 common-size balance sheets for Just Dew It.
Expert Solution & Answer
Want to see the full answer?
Check out a sample textbook solution
Students have asked these similar questions
In cell D22, by using cell references, calculate the total long-term assets for year 2014 Use the relevant cells from the given data in the balance sheet. In call D23, by using a cell reference, calculate the total assets for year 2014. Refer to the relevant cell from the given data in the balance sheet. Note: The total assets must equal the total liabilities and owners' equity." in cell D18, by using cell references, calculate the total current assets for year 2014. Use the relevant cells in the balance sheet. In cell D16, by using cell references, calculate the accounts receivable for year 2014. Use the relevant cells in the balance sheet, in cell H14, by using cell references, calculate the accounts payable for year 2014. Use the relevant cells from the given cata in the balance sheet. In cell H22, by using cell references, calculate the total owners' equity for year 2014. Use the relevant cells from the given data in the balance sheet. In cell H18, by using cell references,…
Financial Statements Analysis and Interpretations
Instructions:
1. Using the provided data below, prepare a Statement of Financial Position - Vertical
Analysis.
2. Compute for the following financial ratios and provide interpretation for each item.
a. Current Ratio
b. Working Capital
c. Debt-to-Equity Ratio
d. Debt Ratio
e. Asset Turnover Ratio
3. You may use any desired business name.
4. Use the space provided for your answer.
Given:
2017
2016
P 358,950.00
P 184,560.00
P 365,450.00
P 450,355.00
P 252,260.00
P 653,550.00
P 300,000.00
P 600,000.00
P 943,105.00
P 65,000.00
P 277,145.00
P 68,505.00
P 285,000.00
P 235,000.00
P 345,650.00
P 745,000.00
P 150,000.00
P 700,000.00
P 800,000.00
Accounts Payable
Accrued Expenses
Accounts Receivable
Cash
Inventory
Fixed Assets
Marketable Securities
Mortgage Payable
Owner's Capital
Prepaid Insurance
85,000.00
Using the Data below create a balance sheet. This should be comparative and classified in proper format for the fiscal years 2015 and 2016.Just use the amounts for each year and ignore whether its credit and debit.
Chapter 3 Solutions
Fundamentals of Corporate Finance
Ch. 3.1 - Prob. 3.1ACQCh. 3.1 - Prob. 3.1BCQCh. 3.2 - Prob. 3.2ACQCh. 3.2 - Name two types of standardized statements and...Ch. 3.3 - What are the five groups of ratios? Give two or...Ch. 3.3 - Given the total debt ratio, what other two ratios...Ch. 3.3 - Turnover ratios all have one of two figures as the...Ch. 3.3 - Profitability ratios all have the same figure in...Ch. 3.4 - Return on assets, or ROA, can be expressed as the...Ch. 3.4 - Return on equity, or ROE, can be expressed as the...
Ch. 3.5 - Prob. 3.5ACQCh. 3.5 - Prob. 3.5BCQCh. 3.5 - Prob. 3.5CCQCh. 3.5 - Prob. 3.5DCQCh. 3 - Prob. 3.1CTFCh. 3 - Prob. 3.2CTFCh. 3 - What is the correct formula for computing the...Ch. 3 - Prob. 3.5CTFCh. 3 - Current Ratio [LO2] What effect would the...Ch. 3 - Current Ratio and Quick Ratio [LO2] In recent...Ch. 3 - Prob. 3CRCTCh. 3 - Prob. 4CRCTCh. 3 - Prob. 5CRCTCh. 3 - Prob. 6CRCTCh. 3 - Prob. 7CRCTCh. 3 - Prob. 8CRCTCh. 3 - Prob. 9CRCTCh. 3 - Industry-Specific Ratios [LO2] There are many ways...Ch. 3 - Prob. 11CRCTCh. 3 - Prob. 12CRCTCh. 3 - Calculating Liquidity Ratios [LO2] SDJ, Inc., has...Ch. 3 - Calculating Profitability Ratios [LO2] Shelton,...Ch. 3 - Calculating the Average Collection Period [LO2]...Ch. 3 - Calculating Inventory Turnover [LO2] The Green...Ch. 3 - Calculating Leverage Ratios [LO2] Levine, Inc.,...Ch. 3 - Calculating Market Value Ratios [LO2] Makers Corp....Ch. 3 - DuPont Identity [LO4] If Roten Rooters, Inc., has...Ch. 3 - DuPont Identity [LO4] Zombie Corp. has a profit...Ch. 3 - Prob. 9QPCh. 3 - Prob. 10QPCh. 3 - Prob. 11QPCh. 3 - Equity Multiplier and Return on Equity [LO3] SME...Ch. 3 - Just Dew It Corporation reports the following...Ch. 3 - Prob. 14QPCh. 3 - Prob. 15QPCh. 3 - Prob. 16QPCh. 3 - Calculating Financial Ratios [LO2] Based on the...Ch. 3 - Using the DuPont Identity [LO3] Y3K, Inc., has...Ch. 3 - Days Sales in Receivables [LO2] A company has net...Ch. 3 - Ratios and Fixed Assets [LO2] The Caughlin Company...Ch. 3 - Profit Margin [LO4] In response to complaints...Ch. 3 - Return on Equity [LO2] Firm A and Firm B have...Ch. 3 - Calculating the Cash Coverage Ratio [LO2] Ugh...Ch. 3 - Cost of Goods Sold [LO2] W B Corp. has current...Ch. 3 - Prob. 25QPCh. 3 - Some recent financial statements for Smolira Golf...Ch. 3 - DuPont Identity [LO3] Construct the DuPont...Ch. 3 - Prob. 28QPCh. 3 - Market Value Ratios [LO2] Smolira Golf Corp. has...Ch. 3 - Tobins Q [LO2] What is Tobins Q for Smolira Golf?...Ch. 3 - Using the financial statements provided for SS...Ch. 3 - Mark and Todd agree that a ratio analysis can...Ch. 3 - Compare the performance of SS Air to the industry....
Knowledge Booster


Learn more about
Need a deep-dive on the concept behind this application? Look no further. Learn more about this topic, finance and related others by exploring similar questions and additional content below.Similar questions
- https://www.unilever-caribbean.com/files/6eae8d2b-daec-43df-9ae2-94a5db0afac2/nlatam-pdf-unilever-financial-statements-2022-final-full-summary.pdf Financial Reporting Analysis: Use the link above to access Unilever Caribbean Limited Annual Report 2022 to answer the Questions. a) Evaluate the company’s latest annual financial statements (balance sheet, income statement, and cash flow statement) and comment on the company's financial performance and position. In your response, use the requirements of IAS 1 as a guide. b) Identify and discuss key accounting principles and standards applied in the company’s financial reporting process indicating their reasons for choosing these and how they were applied. Comment briefly on the appropriateness of the choices made given the company’s industry, location and type (e.g. MNC, regional conglomerate, etc.) c) Critically analyze any significant accounting policies and estimates disclosed in the notes to the financial statements. In your answer,…arrow_forwardSolve this question with steps please. The subject is financial management. Prepare the 2015 combined common size, common base year balance sheet .arrow_forwardEvaluation: Financial Statements Analysis and Interpretations Instructions: 1. Using the provided data below, prepare a Statement of Financial Position - Vertical Analysis. 2. Compute for the following financial ratios and provide interpretation for each item. a. Current Ratio b. Working Capital c. Debt-to-Equity Ratio d. Debt Ratio e. Asset Turnover Ratio 3. You may use any desired business name. 4. Use the space provided for your answer. Given: 2017 2016 P 358,950.00 P 184,560.00 P 365,450.00 P 450,355.00 P 252,260.00 P 653,550.00 P 300,000.00 P 800,000.00 P 943,105.00 P 65,000.00 P 277,145.00 P 68,505.00 P 285,000.00 P 235,000.00 P 345,650.00 P 745,000.00 P 150,000.00 P 700,000.00 P 800,000.00 85,000.00 Accounts Payable Accrued Expenses Accounts Receivable Cash Inventory Fixed Assets Marketable Securities Mortgage Payable Owner's Capital Prepaid Insurancearrow_forward
- Visit the website of the US Securities and Exchange Commission (SEC) https://www.sec.gov/edgar/searchedgar/companysearch.html Search for the latest Form 10-K for a company you would like to analyze. Submit a short memo that A. Includes the name of the company you have chosen.B. Review the company’s end-of-period Balance Sheet to determine the following: Total assets Total liabilities Total equity C. Compare beginning and ending Assets totals and discuss the amount of change.D. Compare beginning and ending Liabilities totals and discuss the amount of change.E. Compare beginning and ending Equity totals and discuss the amount of change. Please provide a link to the company’s Form 10-K to allow accurate verification of your answers.arrow_forwardO DIRECTIONS: Using these data from Rollaird Company's comparative balance sheets, perform a horizontal analysis. Use Ch. 13, "Financial Analysis: The Big Picture," as guidance. Accounts Receivable Inventory Total Assets Dec. 31, 2022 Dec. 31, 2021 460,000 780,000 3,164,000 Example: NOTE: When entering your numbers, use whole numbers in the equation, and 1 decimal point for the answer, as seen in the example below. The text box will highlight red if incorrect after clicking the Submit button (bottom right corner). 400,000 650,000 2,800,000 Accounts Receivable 30000 ÷ •1• 500000 6.0 % olo % 010arrow_forwardO DIRECTIONS: Using these data from Rollaird Company's comparative balance sheets, perform a horizontal analysis. Use Ch. 13, "Financial Analysis: The Big Picture," as guidance. Accounts Receivable Inventory Total Assets Dec. 31, 2022 Dec. 31, 2021 460,000 780,000 3,164,000 Example: NOTE: When entering your numbers, use whole numbers in the equation, and 1 decimal point for the answer, as seen in the example below. The text box will highlight red if incorrect after clicking the Submit button (bottom right corner). 400,000 650,000 2,800,000 Accounts Receivable 30000 ÷ 500000 400000 || || 6.0 I % % Kay Partners and Your Business Model oloarrow_forward
- DIRECTIONS: Using these data from Rollaird Company's comparative balance sheets, perform a horizontal analysis. Use Ch. 13, "Financial Analysis: The Big Picture," as guidance. Accounts Receivable Inventory Total Assets Dec. 31, 2022 Dec. 31, 2021 460,000 780,000 3,164,000 Example: NOTE: When entering your numbers, use whole numbers in the equation, and 1 decimal point for the answer, as seen in the example below. The text box will highlight red if incorrect after clicking the Submit button (bottom right corner). 400,000 650,000 2,800,000 Accounts Receivable 30000 ÷ 500000 = ·I. = 6.0 % %arrow_forwardDIRECTIONS: Using these data from Rollaird Company's comparative balance sheets, perform a vertical analysis. Use Ch. 13, "Financial Analysis: The Big Picture," as guidance. Accounts Receivable Inventory Total Assets Dec. 31, 2022 460,000 780,000 3,164,000 Example: Dec. 31, 2021 NOTE: When entering your numbers, use whole numbers in the equation, and 1 decimal point for the answer, as seen in the example below. The text box will highlight red if incorrect after clicking the Submit button (bottom right corner). Accounts Receivable 2022 400,000 650,000 2,800,000 30000 ·I· 500000 = = 6.0 % %arrow_forwardDIRECTIONS: Using these data from Rollaird Company's comparative balance sheets, perform a vertical analysis. Use Ch. 13, "Financial Analysis: The Big Picture," as guidance. Accounts Receivable Inventory Total Assets Dec. 31, 2022 460,000 780,000 3,164,000 Example: Dec. 31, 2021 NOTE: When entering your numbers, use whole numbers in the equation, and 1 decimal point for the answer, as seen in the example below. The text box will highlight red if incorrect after clicking the Submit button (bottom right corner). Accounts Receivable 2022 400,000 650,000 2,800,000 30000 ÷ 500000 = 6.0 % %arrow_forward
- Please Complete the Following: 1. Complete a vertical and horizontal analysis on the tabs labeled "Balance Sheet" and "Income Statement", use total assets on the balance sheet and net sales on the income statement for your vertical analysis. 2. Using the balance sheet and income statement, complete the ratios on the tab labeled "Ratios" 3. Answer the final OBSERVATION QUESTION (listed under Ratios calculations) Consolidated Balance Sheets (USD $) 12/31/2020 Vertical Analysis 12/31/2019 Vertical Analysis Horizontal Analysis In Millions, unless otherwise specified Current Assets: Cash and Cash Equivalents $1,723 $1,929 Receivables, net 1,484 1,398 Merchandise Inventories 11,079 11,057 Other Current Assets 1,016 895 Total Current Assets 15,302 15,279 Property and Equipment, at…arrow_forwardAnalyze the financial statements of the company to you in terms of:1) Liquidity 2) Solvency3) Asset management4) Debt management5) Profitability2020 Analysis BUT also compare with 2018 - 2019. Please show your solution on computation.arrow_forwardBelow is the balance sheet and income statement for Chin Corporation. You are needed to analyze the financial statements. Use the horizontal, vertical, ratio methods to analyze the financial statements. For the vertical and horizontal analysis, type the accounts and dollar values for the years 2018 and 2017 (as listed on the financial statements even if there is no dollar value for an account). For the ratio analysis, make sure to compute 2 ratios from each section. Income Statement Period Ending: 12/31/2018 12/31/2017 Total Revenue $76,512,000 $78,291,000 Cost of Revenue $54,884,000 $56,586,000 Gross Profit $21,628,000 $21,706,000 Operating Expenses Research and Development $0 $0 Sales, General, and Admin. $13,886,000 $13,599,000 Non-Recurring Items $0 $0 Other Operating Items $0 $0 Operating Income $7,832,000 $8,079,000 Add'l income/expense items -$323,000…arrow_forward
arrow_back_ios
SEE MORE QUESTIONS
arrow_forward_ios
Recommended textbooks for you
 Financial Accounting: The Impact on Decision Make...AccountingISBN:9781305654174Author:Gary A. Porter, Curtis L. NortonPublisher:Cengage Learning
Financial Accounting: The Impact on Decision Make...
Accounting
ISBN:9781305654174
Author:Gary A. Porter, Curtis L. Norton
Publisher:Cengage Learning
The KEY to Understanding Financial Statements; Author: Accounting Stuff;https://www.youtube.com/watch?v=_F6a0ddbjtI;License: Standard Youtube License