
PRIN.OF CORPORATE FINANCE
13th Edition
ISBN: 9781260013900
Author: BREALEY
Publisher: RENT MCG
expand_more
expand_more
format_list_bulleted
Concept explainers
Videos
Textbook Question
Chapter 28, Problem 3PS
Performance measures* Table 28.8 gives abbreviated balance sheets and income statements for Walmart. At the end of fiscal 2017, Walmart had 2,960 million shares outstanding with a share price of $106. The company’s weighted-average cost of capital was about 5%. Assume the marginal corporate tax rate was 35%. Calculate:
- a. Market value added.
- b. Market-to-book ratio.
- c. Economic value added.
- d. Return on start-of-the-year capital.
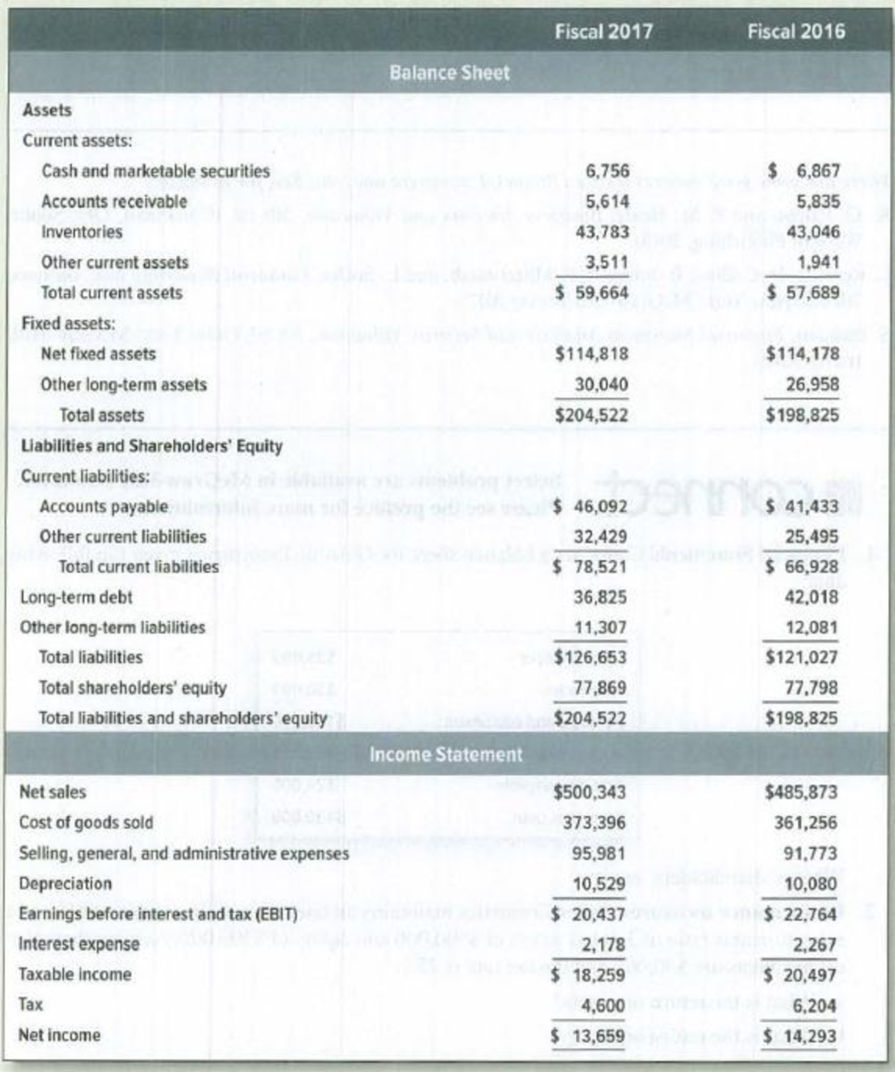
TABLE 28.8 Balance sheets and income statement for Walmart, fiscal 2017 and 2016 (figures in $ millions)
Expert Solution & Answer
Want to see the full answer?
Check out a sample textbook solution
Students have asked these similar questions
Below are the ratio results for Abcom for the year 2022.
Performance
Operating margin -18.66%
Asset turnover 0.16
Return on Capital Employed -7.64%
Working capital
Inventory days 88.88 days
Debtor days 46.18 days
Trade creditor days 68.11 days
Liquidity
Current ratio 0.30
Acid test 0.25
Solvency
Interest cover -2.56
Shareholder's view
Return on equity 7.16%
Required;
Analyse and interpret the meaning of these results.
Analyze the following ratios (Good/Not good, Undervalued/Overvalued, or just OK) based on the given industry averages.
Ratios
Annual Data
Industry Average
Interpretation
Current
5.7
4
Days Sales Outstanding
37 days
42 days
Total Debt to Total Capital
47.80%
32.60%
Times-Interest Earned
2.2
6
Profit Margin
6.10%
6.00%
Return on Invested Capital
10.03%
10.00%
Enterprise Value to EBITDA
0.87
1.12
Provide a decision for each analysis.
Calculate profitability measures The following information was available for the year ended December 31, 2016:Sales $ 400,000Net income 60,000Average total assets 1,000,000Average total stockholders' equity 600,000Dividends per share 2.40Earnings per share 6.00Market price per share at year-end 96.00Required:Calculate margin, turnover, and ROI for the year ended December 31, 2016.Calculate ROE for the year ended December 31, 2016.Calculate the price/earnings ratio for 2016.Calculate the dividend payout ratio for 2016.Calculate the dividend yield for 2016.
Chapter 28 Solutions
PRIN.OF CORPORATE FINANCE
Ch. 28 - Prob. 1PSCh. 28 - Performance measures Keller Cosmetics maintains an...Ch. 28 - Performance measures Table 28.8 gives abbreviated...Ch. 28 - Performance measures Describe some alternative...Ch. 28 - Financial ratios Look again at Table 28.8, which...Ch. 28 - Prob. 6PSCh. 28 - Financial ratios True or false? a. A companys...Ch. 28 - Financial ratios Sara Togas sells all its output...Ch. 28 - Financial ratios As you can see, someone has...Ch. 28 - Prob. 10PS
Ch. 28 - Prob. 11PSCh. 28 - Prob. 12PSCh. 28 - Prob. 13PSCh. 28 - Prob. 14PSCh. 28 - Prob. 15PSCh. 28 - Prob. 16PSCh. 28 - Prob. 17PSCh. 28 - Prob. 18PSCh. 28 - Prob. 19PSCh. 28 - Prob. 20PSCh. 28 - Prob. 21PSCh. 28 - Prob. 22PSCh. 28 - Prob. 23PSCh. 28 - Prob. 25PSCh. 28 - Prob. 26PSCh. 28 - Prob. 27PS
Knowledge Booster


Learn more about
Need a deep-dive on the concept behind this application? Look no further. Learn more about this topic, finance and related others by exploring similar questions and additional content below.Similar questions
- Measures of liquidity, solvency, and profitability The comparative financial statements of Marshall Inc. are as follows. The market price of Marshall common stock was 82.60 on December 31, 20Y2. Instructions Determine the following measures for 20Y2, rounding to one decimal place, including percentages, except for per-share amounts: 1. Working capital 2. Current ratio 3. Quick ratio 4. Accounts receivable turnover 5. Number of days sales in receivables 6. Inventory turnover 7. Number of days sales in inventory 8. Ratio of fixed assets to long-term liabilities 9. Ratio of liabilities to stockholders equity 10. Times interest earned 11. Asset turnover 12. Return on total assets 13. Return on stockholders equity 14. Return on common stockholders equity 15. Earnings per share on common stock 16. Price-earnings ratio 17. Dividends per share of common stock 18. Dividend yieldarrow_forwardMeasures of liquidity, solvency, and profitability The comparative financial statements of Marshall Inc. are as follows. The market price of Marshall common stock was 82.60 on December 31, 20Y2. Instructions Determine the following measures for 20Y2 (round to one decimal place, including percentages, except for per-share amounts): 1. Working capital 2. Current ratio 3. Quick ratio 4. Accounts receivable turnover 5. Number of days sales in receivables 6. Inventory turnover 7. Number of days sales in inventory 8. Ratio of fixed assets to long-term liabilities 9. Ratio of liabilities to stockholders equity 10. Times interest earned 11. Asset turnover 12. Return on total assets 13. Return on stockholders equity 14. Return on common stockholders equity 15. Earnings per share on common stock 16. Price-earnings ratio 17. Dividends per share of common stock 18. Dividend yieldarrow_forwardEstimating Share Value Using the ROPI Model The following are forecasts of Abercrombie & Fitch's sales, net operating profit after tax (NOPAT), and net operating assets (NOA) as of January 29, 2011. Refer to the information in the table to answer the following requirements. Reported Horizon Period (In millions) 2011 2012 2013 2014 2015 Terminal Period Sales $ 3,469 $ 3,989 $ 4,587 $ 5,275 $ 6,066 $ 6,187 NOPAT 152 319 367 422 485 495 NOA 1,032 1,173 1,349 1,551 1,784 1,820 Answer the following requirements assuming a discount rate (WACC) of 10%, a terminal period growth rate of 2%, common shares outstanding of 87.2 million, and net nonoperating obligations (NNO) of $(858) million. (Negative NNO reflects net nonoperating assests such as investments rather than net obligations)(a) Estimate the value of a share of Abercrombie & Fitch common stock using the residual operating income (ROPI) model as of January 29, 2011. Rounding instructions: Round answers to…arrow_forward
- 5. Profitability ratios Profitability ratios help in the analysis of the combined impact of liquidity ratios, asset management ratios, and debt management ratios on the operating performance of a firm. Your boss has asked you to calculate the profitability ratios of Diusitech Inc. and make comments on its second-year performance as compared with its first-year performance. The following shows Diusitech Inc.'s income statement for the last two years. The company had assets of $4,700 million in the first year and $7,518 million in the second year. Common equity was equal to $2,500 million in the first year, and the company distributed 100% of its earnings out as dividends during the first and the second years. In addition, the firm did not issue new stock during either year. Diusitech Inc. Income Statement For the Year Ending on December 31 (Millions of dollars) Year 2 Year 1 2,540 2,000 1,610 1,495 127 80 1,737 803 80 723 181 542 Net Sales Operating costs except depreciation and…arrow_forwardIn 2016, the Allen corporation had sales of $63 million, total assets of $44 million, and total liabilities of $15 million. The interest rate on the company’s debt is 5.7 percent, and it’s tax rate is 35 percent. The operating profit margin is 14 percent. B. Calculate the firm’s operating return on assets and return on equity. Operating return on assets is 20.05% Round to two decimal places. The return on equity is Round to two decimal places.arrow_forwardThe most recent financial statements for Mc Govney Co. are shown here: Income Statement Sales Costs Taxable Income Taxes (34%) Net Income Current Asset Fixed Asset $46,911 $38,882 ? ? ? Balance Sheet $20,638 Long-term Debt Equity $88,120 $45,042 ? Assets and costs are proportional to sales. The company maintains a constant 19 percent dividend payout ratio and a constant debt-equity ratio. What is the maximum increase in sales (in $) that can be sustained assuming no new equity is issued?arrow_forward
- Profitability ratios: Cisco Systems has total assets of $35.594 billion, total debt of $9.678 billion, and net sales of $22.045 billion. Its net profit margin for the year is 20 percent, while the operating profit margin is 30 percent. What are Cisco’s net income, EBIT ROA, ROA, and ROE?arrow_forwardFinancial Accounting CMulford: Financial Statement Analysis: 13 Using Return on Assets and Return on Equity to Compare Performance Across Companies Thiokol Corp. and Wyman-Gordon, Inc. In a recent fiscal year, Thiokol Corp. reported sales of $889.5 million and net income of $51.4 million. For the same year, Wyman-Gordon, reported sales of $499.6 million and net income of $25.2 million, about half the income of Thiokol. Both companies are in the same industry, aerospace and defense. Use the data provided below to compare financial performance for the two companies (amounts in millions). Thiokol $ 889.5 $ 51.4 $ 818.3 $ 447.9 Wyman-Gordon $ 499.6 $ 25.2 $ 375.9 $ 109.9 Sales Net income Total assets Shareholders' equity Calculate: Return on assets Return on equity Why is Return on equity so different for the two companies?arrow_forwardThe _________ is the internal rate of return a firm must earn on its investment in order to maintain the market value of its stock. a. gross profit margin b. IRR c. Cost of Capital d. net profit margin A snapshot from Violet Flowers Ltd.'s financial information reveals the following for years 2018 and 2019: Item 2018 2019 Long Term Debt $4,600,000 $4,900,000 Interest expense $600,500 $870,000 Dividends $400,000 $590,000 Common Stock $1,740,000 $1,815,000 Additional paid-in surplus $4,200,000 $4,500,000 Violet Flowers' FCF for 2019 was: a. $300,000 b. $515,000 c. $785,000 d. $270,000arrow_forward
- 41. For fiscal year 2015, Costco Wholesale Corporation (COST) had a net profit margin of 2.05%, asset turnover of 3.48, and a book equity multiplier of 3.15. a. Use this data to compute Costco's ROE using the DuPont Identity. b. If Costco's managers wanted to increase its ROE by one percentage point, how much higher would their asset turnover need to be? c. If Costco's net profit margin fell by one percentage point, by how much would their asset turnover need to increase to maintain their ROE?arrow_forwardThe most recent financial statements for Mandy Company are shown here: Income Statement Balance Sheet $ 11,760 27,450 $ 39,210 Sales Costs Taxable income Taxes (24%) Net income $19,200 13,050 $ 6,150 Sustainable growth rate 1,476 $4,674 Current assets Fixed assets Total Debt Equity % Total Assets and costs are proportional to sales. Debt and equity are not. The company maintains a constant 45 percent dividend payout ratio. What is the sustainable growth rate? (Do not round intermediate calculations and enter your answer as a percent rounded to 2 decimal places, e.g., 32.16.) $ 15,880 23,330 $ 39,210arrow_forwardTibbs Inc. had the following data for the most recent year: Net income = $300; Net operating profit after taxes (NOPAT) = $380; Total assets = $2,500; Short-term investments = $200; Stockholders' equity = $1,800; Total debt = $700; and Total operating capital = $2,300. What was its return on invested capital (ROIC)? Select the correct answer. a. 16.92% b. 16.52% c. 17.12% d. 16.72% e. 16.32%arrow_forward
arrow_back_ios
SEE MORE QUESTIONS
arrow_forward_ios
Recommended textbooks for you

 EBK CONTEMPORARY FINANCIAL MANAGEMENTFinanceISBN:9781337514835Author:MOYERPublisher:CENGAGE LEARNING - CONSIGNMENT
 Managerial AccountingAccountingISBN:9781337912020Author:Carl Warren, Ph.d. Cma William B. TaylerPublisher:South-Western College Pub
 Financial AccountingAccountingISBN:9781337272124Author:Carl Warren, James M. Reeve, Jonathan DuchacPublisher:Cengage Learning
 Financial And Managerial AccountingAccountingISBN:9781337902663Author:WARREN, Carl S.Publisher:Cengage Learning,
EBK CONTEMPORARY FINANCIAL MANAGEMENT
Finance
ISBN:9781337514835
Author:MOYER
Publisher:CENGAGE LEARNING - CONSIGNMENT
Managerial Accounting
Accounting
ISBN:9781337912020
Author:Carl Warren, Ph.d. Cma William B. Tayler
Publisher:South-Western College Pub
Financial Accounting
Accounting
ISBN:9781337272124
Author:Carl Warren, James M. Reeve, Jonathan Duchac
Publisher:Cengage Learning
Financial And Managerial Accounting
Accounting
ISBN:9781337902663
Author:WARREN, Carl S.
Publisher:Cengage Learning,
Dividend disocunt model (DDM); Author: Edspira;https://www.youtube.com/watch?v=TlH3_iOHX3s;License: Standard YouTube License, CC-BY