
Concept explainers
Videos
In the descriptions of experiments given in Exercises 2.15–2.18, identify the important features of each design. Include as many of the components listed in Exercise 2.14 as needed to adequately describe the design.
2.17 In place of the design described in Exercise 2.16, make the following change. Within each hospital, the three treatments will be randomly assigned to the patients, with two patients in each ward receiving D1, two patients receiving D2, and two patients receiving the placebo.
2.14 The process engineer designed a study to evaluate the quality of plastic irrigation pipes. The study involved a total of 48 pipes; 24 pipes were randomly selected from each of the company’s two manufacturing plants. The pipes were heat-treated at one one of four temperatures (175, 200, 225, 250°F). The pipes were chemically treated with one of three types of hardeners (H1, H2, H3). The deviations from the nominal compressive strength were measured at five locations on each of the pipes.
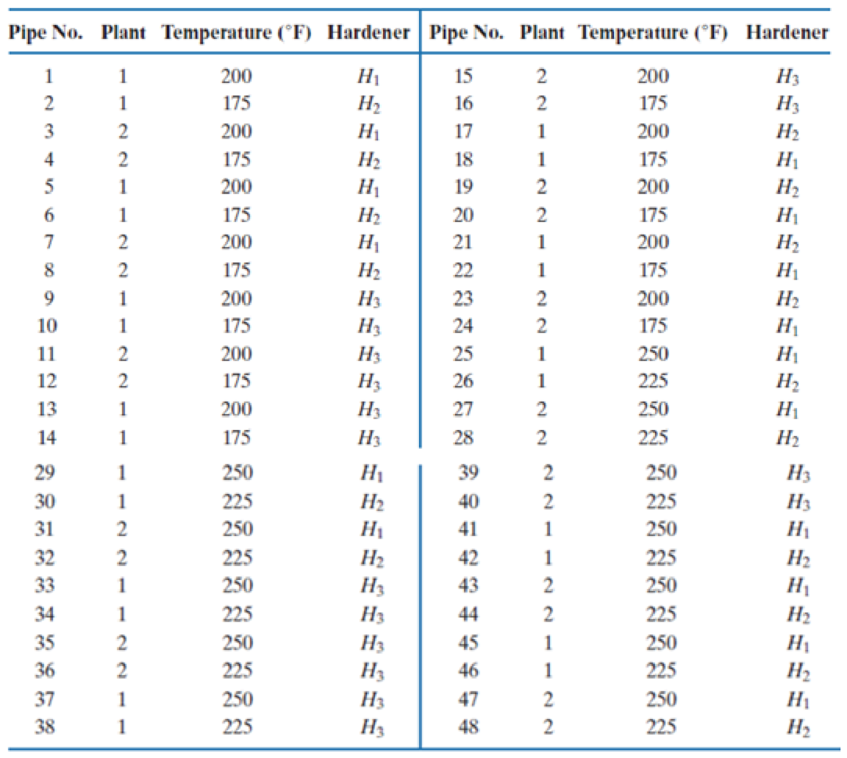
Identify each of the following components of the experimental design.
- a. Factors
- b. Factor levels
- c. Blocks
- d. Experimental unit
- e. Measurement unit
- f. Replications
- g.
Covariates - h. Treatments
Want to see the full answer?
Check out a sample textbook solution
Chapter 2 Solutions
An Introduction to Statistical Methods and Data Analysis


- A nutritionist randomly divided 15 cyclists into three groups of 5 cyclists each. Cyclists in the first group were given vitamin supplements, which they took with their meals for the next three weeks. The second group was instructed to eat certain types of high-fiber whole grain cereals for the next three weeks. Cyclists in the third group ate the same way they normally eat. After three weeks, each cyclist rode 6 miles, from which the following times were recorded: Vitamin group 15.6 16.4 17.2 15.5 16.3 Fiber group 17.1 16.3 15.8 16.4 16.0 Control group 15.9 17.2 16.4 15.4 16.8 Is the data consistent with the hypothesis that vitamin supplements or fiber cereals do not affect the speed of cyclists? Use a 1% significance level.arrow_forwardCheck whether the representation of pets in the population is different from: dog 41%, cat 33%, fish 10%, other 16%. α = 0.05. I am sending a screenshot with only one PART of the data in the attachmentarrow_forwardCellulon, a manufacturer of home insulation, wants to develop guidelines for builders and consumers on how the thickness of the insulation in the attic of a home and the outdoor temperature affect natural gas consumption. In the laboratory, it varied the insulation thickness and temperature. A few of the findings are:arrow_forward
- In a study, the effects of the mane of a male lion as a signal of quality to mates and rivals was explored. Four life-sized dummies of male lions provided a tool for testing female response to the unfamiliar lions whose manes varied by length (long or short) and color (blonde or dark). The female lions were observed to see whether they approached each of the four life-sized dummies. Complete parts (a) through (e) below. a. Identify the experimental units. Choose the correct answer below. The female lions The male dummies The mane colors The mane lengths Part 2 b. Identify the response variable. Choose the correct answer below. A. Whether or not (yes or no) the mane length affected how the female lions reacted to a male dummy. B. Whether or not (yes or no) the female lions approached the same dummies. C. Whether or not (yes or no) the female lions approached a male dummy. D. Whether or not…arrow_forwarda.State the predictors available in this model.arrow_forwardA test of body reaction to the Malaysian citizens who have taken their vaccine was conducted. Selected citizens who got side effect are categorised according to their blood type and the type of vaccine received. From a sample of 250 citizens, 150 of them were administered with Sinovac while the rest received AstraZeneca. Table 4 shows the number of citizens who had side effect after being vaccinated. Type of vaccine Blood type A B AB O Sinovac 50 M 50 20 AstraZeneca 30 20 20 N Does different blood type among people who had side effect relate to the type of vaccinereceived at A=0.025?arrow_forward
- Four research participants take a test of manual dexterity (high scores mean better dexterity) and an anxiety test (high scores mean more anxiety). The scores are as follows: Person Dexterity Anxiety 1 1 10 2 1 8 3 2 4 4 4 -2 Describe the process your research team would go through by completing the following: Create a scatter diagram of the scores.arrow_forwardA pharmaceutical company conducts an experiment to test the effect of a new cholesterol medication. The company randomly selects 5 subjects and assigned to each of three treatment groups. Within each treament group, subjects receive a different dose of the new medication. After 30 days, doctors measure the cholesterol level of each subject. The within groups degrees of freedom is: A. 5 В. 2 C. 12 D. 14 A. В D Answerarrow_forwardExercise ( H.W): 4/ A survey of 500 television watchers produced the following information. football games 195 = basketball games 115 = hockey games hockey and basketball 285watch 50 = 45 = football and basketball 70 football and hockey %3D 50 do not watch any of three games a/ How many people in the survey watch all three games b/ How many people in the survey watch exactly one of the three gamesarrow_forward
- Many golfers wear wrist bracelets containing magnets because they claim the magnets improve balance and the length of shots played off the tee. A golfer would like to determine if the claim has merit and finds 200 volunteers who play golf to participate in an experiment. Half of the golfers are randomly assigned to wear a bracelet with magnets, while the other half wear a bracelet without magnets. Each golfer plays normally for a month, after which the length of their shots in a subsequent round is recorded. What is the response variable in this experiment? the age of each golfer the 200 volunteers the length of shots played by the golfers whether the golfers wear or do not wear the braceletarrow_forwardTwenty sculptors were asked to produce molds of a model using a different medium for each one. The options are: having the model present at the session, using a photograph and seeing the model, but having to create the sculpture from memory. The sculptor then rated the difficulty of creating each piece of artwork (1=easy; 10 = difficult). The data is provided below: Subject Model Present Photo Memory 1 9 5 5 2 3 9 6 3 6 8 9 4 1 6 10 5 5 7 7 6 9 4 1 7 8 8 10 8 6 9 4 9 8 3 8 10 1 8 10 11 8 5 10 12 8 7 5 13 6 10 3 14 9 2 7 15 5 8 9 16 1 6 8 17 7 4 7 18 10 9 1 19 3 6 10 20 10 10 10 1. Use the data above to conduct a One-Way Repeated Measures ANOVA. The JASP output of all the statistical analyses performed as well as the file that was produced should be provided. 2. Interpret and report on the relevant information presented in the following tables: (i) Descriptive Statistics (ii) Mauchly's test (iii) Test for normality (iv) Pairwise…arrow_forwardOne of the markers of toxicity of a proposed drug during drug development is loss of weight in the exposed individuals. Female was exposed to a proposed drug and the effects were observed during a 28 days period. Another record only the vehicle. These two groups were animals of similar age and gender and were all treated in similar ways regarding nutrition, water and environment. Result of the weight of 16 male mice before and after treatment are tabulated in table 2 below: Table 2: Table of the weights (gm) of 16 male mice before (X1a) and after treatment (X1b) X1a 20 21.2 20.6 19.5 18.9 20.2 21 19.6 17.8 18.5 18.3 19.2 19.6 19.4 19.2 19 X1b 20.9 21.9 21.2 21 19.9 20.9 21.8 21 18.6 19.9 19 20 20.1 20 20 20.7 Determine if these was a statistical weight difference (gain/loss in the 2 groups) Using paired t-testarrow_forward
 MATLAB: An Introduction with ApplicationsStatisticsISBN:9781119256830Author:Amos GilatPublisher:John Wiley & Sons Inc
 Probability and Statistics for Engineering and th...StatisticsISBN:9781305251809Author:Jay L. DevorePublisher:Cengage Learning
 Statistics for The Behavioral Sciences (MindTap C...StatisticsISBN:9781305504912Author:Frederick J Gravetter, Larry B. WallnauPublisher:Cengage Learning
 Elementary Statistics: Picturing the World (7th E...StatisticsISBN:9780134683416Author:Ron Larson, Betsy FarberPublisher:PEARSON
 The Basic Practice of StatisticsStatisticsISBN:9781319042578Author:David S. Moore, William I. Notz, Michael A. FlignerPublisher:W. H. Freeman
 Introduction to the Practice of StatisticsStatisticsISBN:9781319013387Author:David S. Moore, George P. McCabe, Bruce A. CraigPublisher:W. H. Freeman