
An Introduction to Statistical Methods and Data Analysis
7th Edition
ISBN: 9781305269477
Author: R. Lyman Ott, Micheal T. Longnecker
Publisher: Cengage Learning
expand_more
expand_more
format_list_bulleted
Videos
Textbook Question
Chapter 2.8, Problem 14E
The process engineer designed a study to evaluate the quality of plastic irrigation pipes. The study involved a total of 48 pipes; 24 pipes were randomly selected from each of the company’s two manufacturing plants. The pipes were heat-treated at one one of four temperatures (175, 200, 225, 250°F). The pipes were chemically treated with one of three types of hardeners (H1, H2, H3). The deviations from the nominal compressive strength were measured at five locations on each of the pipes.
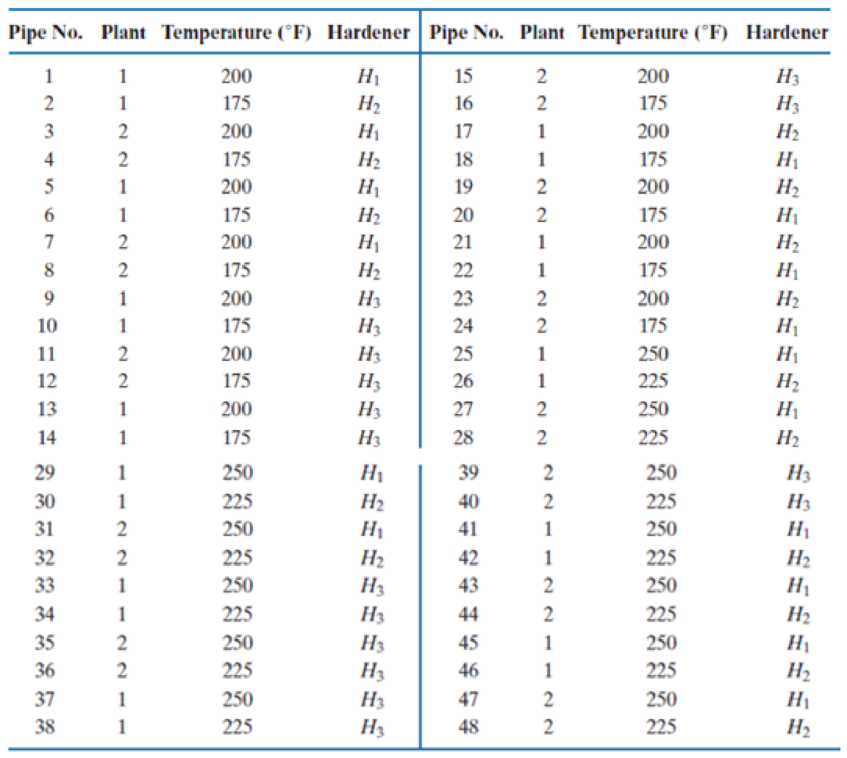
Identify each of the following components of the experimental design.
- a. Factors
- b. Factor levels
- c. Blocks
- d. Experimental unit
- e. Measurement unit
- f. Replications
- g.
Covariates - h. Treatments
Expert Solution & Answer
Want to see the full answer?
Check out a sample textbook solution
Students have asked these similar questions
A crayon manufacturer is comparing the effects of two kinds of yellow dye on the brittleness of crayons. Dye B is more expensive than dye A, but it is thought that it might produce a stronger crayon. Four crayons are tested with each kind of dye, and the impact strength (in joules) is measured for each. The results are as follows: Dye A: 1.0 2.0 1.2 3.0 Dye B: 3.0 3.2 2.6 3.4 a) Can you conclude that the mean strength of crayons made with dye B is greater than that of crayons made with dye A? b) Can you conclude that the mean strength of crayons made with dye B exceeds that of crayons made with dye A by more than 1 J?
An experiment was conducted to study the extrusion process of biodegradable packaging foam. Two of the factors considered for their effect on
the unit density (mg/ml) were the die temperature (145 °C vs. 155 °C) and the die diameter (3 mm vs. 4 mm). The results are stored in [Packaging
Foam 1]. Source: Data extracted from W. Y. Koh, K. M. Eskridge, and M. A. Hanna, "Supersaturated Split-Plot Designs," Journal of Quality
Technology, 45, January 2013, pp. 61-72.At the 0.05 level of significance,
3mm 4mm
57.22
145
72.54
145 53.60 66.70
145 48.13
49.28
145 69.89 44.14
145 62.78
58.37
145 55.18
53.98
155 57.50
63.03
155 54.17 46.73
155 73.86 60.17
155 90.28 46.78
155 88.19 43.27
155 82.61 56.93
Die Temperature
a. is there an interaction between die temperature and die diameter?
b. is there an effect due to die temperature?
c. is there an effect due to die diameter?
d. Plot the mean unit density for each die temperature for each die diameter.
e. What can you conclude about the effect of die…
The quality control engineer at Palmer Industries is interested in estimating the tensile strength of steel wire based on its outside diameter and the amount of molybdenum in the steel. As an experiment, she selected 25 pieces of wire, measured the outside diameters, and determined the molybdenum content. Then she measured the tensile strength of each piece. The results of the first four are recorded in the table.
Tensile Strength
Outside Diameter
Amount of Molybdenum
Place
(PSI ) Y
(mm) X1
(Units) X2
A
11
0.3
6
B
9
0.2
5
C
16
0.4
8
D
12
0.3
7
Using a statistical software package, the QC engineer determined the multiple regression equation to be Y’=-0.5+20X1+1X2.
a) Based on the equation, what is the estimated tensile strength of a steel wire having an outside diameter of .35 mm and 6.4 units of molybdenum?
b) Interpret the value of b1 in the equation.
Chapter 2 Solutions
An Introduction to Statistical Methods and Data Analysis
Ch. 2.8 - In the following descriptions of a study,...Ch. 2.8 - In the following descriptions of a study,...Ch. 2.8 - A news report states that minority children who...Ch. 2.8 - A study was conducted to determine if the...Ch. 2.8 - Prob. 5ECh. 2.8 - A large auto parts supplier with distribution...Ch. 2.8 - The circuit judges in a rural county are...Ch. 2.8 - Prob. 8ECh. 2.8 - Time magazine, in an article in the late 1950s,...Ch. 2.8 - The New York City school district is planning a...
Ch. 2.8 - A professional society, with a membership of...Ch. 2.8 - For each of the following situations, decide what...Ch. 2.8 - For each of the following situations, decide what...Ch. 2.8 - The process engineer designed a study to evaluate...Ch. 2.8 - Prob. 15ECh. 2.8 - In the descriptions of experiments given in...Ch. 2.8 - In the descriptions of experiments given in...Ch. 2.8 - In the descriptions of experiments given in...Ch. 2.8 - A research specialist for a large seafood company...Ch. 2.8 - In Exercises 2.20–2.22, identify whether the...Ch. 2.8 - In Exercises 2.202.22, identify whether the design...Ch. 2.8 - In Exercises 2.20–2.22, identify whether the...Ch. 2.8 - A bakery wants to evaluate new recipes for carrot...Ch. 2.8 - Prob. 24SECh. 2.8 - Prob. 25SECh. 2.8 - Prob. 26SECh. 2.8 - Prob. 27SECh. 2.8 - Prob. 28SECh. 2.8 - Prob. 29SECh. 2.8 - A forester wants to estimate the total number of...Ch. 2.8 - A transportation researcher is funded to estimate...Ch. 2.8 - The department of agriculture in a midwestern...Ch. 2.8 - Prob. 33SECh. 2.8 - A Yankelovich, Skelly, and White poll taken in the...
Knowledge Booster


Learn more about
Need a deep-dive on the concept behind this application? Look no further. Learn more about this topic, statistics and related others by exploring similar questions and additional content below.Similar questions
- The "spring-like effect" in a golf club could be determined by measuring the coefficient of restitution (the ratio of the outbound velocity to the inbound velocity of a golf ball fired at the clubhead). Twelve randomly selected drivers produced by two clubmakers are tested and the coefficient of restitution measured. The data follow: Club 1: 0.8406, 0.8104, 0.8234, 0.8198, 0.8235, 0.8562, 0.8123, 0.7976, 0.8184, 0.8265, 0.7773, 0.7871 Club 2: 0.8305, 0.7905, 0.8352, 0.8380, 0.8145, 0.8465, 0.8244, 0.8014, 0.8309, 0.8405, 0.8256, 0.8476 Test the hypothesis that both brands of ball have equal mean overall distance. Use α = 0.05 and assume equal variances. Question: Reject H0 if t0 < ___ or if t0 > ___.arrow_forwardAn article in the ACI Materials Journal (Vol. 84, 1987, pp. 213-216) describes several experiments investigating the rodding of concrete to remove trapped air. A 3-inch x 6-inch cylinder was used, and the number of times this rod was used is the design variable. The resulting compressive strength of the concrete specimen is the response. The data are shown in the following table. ... Compressive Strength (psi) Rodding Level Observations 10 1530 1530 1440 15 1610 1650 1500 20 1560 1730 1530 25 1500 1490 1510 Calculate the test statistic fo. Input answer up to 2 decimal places. Test Statisticf =1.68 Blank 1 1.68arrow_forwardAn article in the ACI Materials Journal (Vol. 84, 1987, pp. 213-216) describes several experiments investigating the rodding of concrete to remove trapped air. A 3-inch x 6-inch cylinder was used, and the number of times this rod was used is the design variable. The resulting compressive strength of the concrete specimen is the response. The data are shown in the following table. ... Compressive Strength (psi) Rodding Level Observations 10 1530 1530 1440 15 1610 1650 1500 20 1560 1730 1530 25 1500 1490 1510 Calculate the test statistic fo- Input answer up to 2 decimal places. TestStatisticf. Blank 1arrow_forward
- An experiment to compare the tension bond strength of polymer latex modified mortar (Portland cement mortar to which polymer latex emulsions have been added during mixing) to that of unmodified mortar resulted in x = 18.19 kgf/cm? for the modified mortar (m = 42) and y = 16.85 kgf/cm? for the unmodified mortar (n = 30). Let u, and u, be the true average tension bond strengths for the modified and unmodified mortars, respectively. Assume that the bond strength distributions are both normal. Assuming that o, = 1.6 and o, = 1.3, test Hn: 4, - H, = 0 versus H: u, - u, > 0 at level 0.01. Calculate the test statistic and determine the P-value. (Round your test statistic to two decimal places and your P-value to four decimal places.) P-value = Compute the probability of a type II error for the test of part (a) when 4 - Hz = 1. (Round your answer to four decimal places.) Suppose the investigator decided to use a level 0.05 test and vwished B = 0.10 when u, - uz = 1. If m = 42, what value of n…arrow_forwardAn article in the ACI Materials Journal (Vol. 84, 1987, pp. 213-216) describes several experiments investigating the rodding of concrete to remove trapped air. A 3-inch x 6-inch cylinder was used, and the number of times this rod was used is the design variable. The resulting compressive strength of the concrete specimen is the response. The data are shown in the following table. Compressive Strength (psi) Rodding Level Observations 10 1530 1530 1440 15 1610 1650 1500 20 1560 1730 1530 25 1500 1490 1510 Calculate the test statistic fo-arrow_forwardAn engineer wants to compare the tensile strengths of steel bars that are produced using a conventional method and an experimental method. (The tensile strength of a metal is a measure of its ability to resist tearing when pulled lengthwise.) To do so, the engineer randomly selectoarrow_forward
- An experiment to compare the tension bond strength of polymer latex modified mortar (Portland cement mortar to which polymer latex emulsions have been added during mixing) to that of unmodified mortar resulted in x = 18.13 kgf/cm? for the modified mortar (m = 42) and y = 16.85 kgf/cm2 for the unmodified mortar (n = 32). Let u, and u, be the true average tension bond strengths for the modified and unmodified mortars, respectively. Assume that the bond strength distributions are both normal. (a) Assuming that o, = 1.6 and o, = 1.3, test Ho: 4, - H, = 0 versus H: u, - µ, > 0 at level 0.01. Calculate the test statistic and determine the P-value. (Round your test statistic to two decimal places and your p-value to four decimal places.) z = 3.80 P-value = 0.0001 State the conclusion in the problem context. O Fail to reject H,. The data suggests that the difference in average tension bond strengths exceeds 0. O Fail to reject Ho: The data does not suggest that the difference in average…arrow_forwardAn article in the Fire Safety Journal (“The Effect of Nozzle Design on the Stability and Performance of Turbulent Water Jets,” Vol. 4, August 1981) describes an experiment in which a shape factor was determined for several different nozzle designs at six levels of jet efflux velocity. Interest focused on potential differences between nozzle designs (blocks), with velocity considered as a nuisance variable. The data are shown below: Jet Efflux Velocity (m/s) Nozzle Design 11.73 14.37 16.59 20.43 23.46 28.74 1 0.78 0.80 0.81 0.75 0.77 0.78 2 0.85 0.85 0.92 0.86 0.81 0.83 3 0.93 0.92 0.95 0.89 0.89 0.83 4 1.14 0.97 0.98 0.88 0.86 0.83 5 0.97 0.86 0.78 0.76 0.76 0.75 1) Write the null hypothesis and the alternative hypothesis (for the factor). 2) Find the ANOVA table. (round to five decimal places). 3) What is your decision about the null hypothesis, consider ?. 4) If your decision in part (4) was reject , perform Tukey test to determine which pairwise means are…arrow_forwardAn experiment to compare the tension bond strength of polymer latex modified mortar (Portland cement mortar to which polymer latex emulsións have been added during mixing) to that of unmodified mortar resulted in x = 18.11 kgf/cm2 for the modified mortar (m = 42) and y = 16.88 kgf/cm2 for the unmodified mortar (n = 31). Let ₁ and ₂ be the true average tension bond strengths for the modified and unmodified mortars, respectively. Assume that the bond strength distributions are both normal. (a) Assuming that o₁ = 1.6 and ₂ = 1.3, test Ho: ₁ - ₂ = 0 versus H₂: H₁ - H₂> 0 at level 0.01. Calculate the test statistic and determine the P-value. (Round your test statistic to two decimal places and your P-value to four decimal places.) Z = P-value = State the conclusion in the problem context. O Fail to reject Ho. The data suggests that the difference in average tension bond strengths exceeds 0. Fail to reject Ho. The data does not suggest that the difference in average tension bond strengths…arrow_forward
- The City Council proposed to utilize government-owned land with an area of 12,150 square meters. One-third of the area will be used to plant mango trees while the rest of the land is where an emergency field hospital shall be built. As the city engineer, you were tasked to answer the problem: Please give me a detailed illustration and explanation about the representation of variables whereas this is the given: a. the rate at which the total average number of COVID cases is increasing at x=10 tents and dxdt=1 tent per day, given that if 30 tents are built, the average number of COVID cases per tent will be 7 cases while the average number of cases will increase by 2 per tent for each additional tent on the same area due to overcrowding.Thank you so much! Please give me a detailed illustration and explanation about the representation of the variables for the given problemarrow_forwardFoot ulcers are common problem for people with diabetes. Higher skin temperatures on the foot indicate an increased risk of ulcers. The article “An Intelligent Insole for Diabetic Patients with the Loss of Protective Sensation" (Kimberly Anderson, M.S. Thesis, Colorado School of Mines), reports measurements of temperatures, in °F, of both feet for 18 diabetic patients. The results are presented in the Table Q1. Table Ql: Measurements of temperatures, in °F of left foot Vs right foot for 18 diabetic patients Left Foot Right Foot Left Foot Right Foot 80 80 76 81 85 85 89 86 80 86 75 87 82 88 78 78 89 87 80 81 87 82 87 82 78 78 86 85 88 89 76 80 89 90 88 89 (d) Test the slope, ß1 = 1 at 5% level of significance. (e) Calculate the coefficient of correlation r and r2 and then interpret their valuesarrow_forwardAn article in the ACI Materials Journal (Vol. 84, 1987, pp. 213-216) describes several experiments investigating the rodding of concrete to remove trapped air. A 3-inch x 6-inch cylinder was used, and the number of times this rod was used is the design variable. The resulting compressive strength of the concrete specimen is the response. The data are shown in the following table. Compressive Strength (psi) Observations Rodding Level 10 15 20 25 1530 1530 1440 1610 1650 1500 1560 1730 1530 1500 1490 1510 (a) Is there any difference in compressive strength due to the rodding level? Use a = 0.05. Calculate to 2 decimal places for Is there statistical evidence to say that rodding level affects compressive strength? (b) Find to 2 decimal places the P-value for the F-statistic computed in part (a). P-value= (c) Analyze the following residual plots to determine model adequacy, Does the assumption of normality seem reasonable? Does there appear to be an outlier in the data? Does the assumption…arrow_forward
arrow_back_ios
SEE MORE QUESTIONS
arrow_forward_ios
Recommended textbooks for you
 MATLAB: An Introduction with ApplicationsStatisticsISBN:9781119256830Author:Amos GilatPublisher:John Wiley & Sons Inc
 Probability and Statistics for Engineering and th...StatisticsISBN:9781305251809Author:Jay L. DevorePublisher:Cengage Learning
 Statistics for The Behavioral Sciences (MindTap C...StatisticsISBN:9781305504912Author:Frederick J Gravetter, Larry B. WallnauPublisher:Cengage Learning
 Elementary Statistics: Picturing the World (7th E...StatisticsISBN:9780134683416Author:Ron Larson, Betsy FarberPublisher:PEARSON
 The Basic Practice of StatisticsStatisticsISBN:9781319042578Author:David S. Moore, William I. Notz, Michael A. FlignerPublisher:W. H. Freeman
 Introduction to the Practice of StatisticsStatisticsISBN:9781319013387Author:David S. Moore, George P. McCabe, Bruce A. CraigPublisher:W. H. Freeman
MATLAB: An Introduction with Applications
Statistics
ISBN:9781119256830
Author:Amos Gilat
Publisher:John Wiley & Sons Inc
Probability and Statistics for Engineering and th...
Statistics
ISBN:9781305251809
Author:Jay L. Devore
Publisher:Cengage Learning
Statistics for The Behavioral Sciences (MindTap C...
Statistics
ISBN:9781305504912
Author:Frederick J Gravetter, Larry B. Wallnau
Publisher:Cengage Learning
Elementary Statistics: Picturing the World (7th E...
Statistics
ISBN:9780134683416
Author:Ron Larson, Betsy Farber
Publisher:PEARSON
The Basic Practice of Statistics
Statistics
ISBN:9781319042578
Author:David S. Moore, William I. Notz, Michael A. Fligner
Publisher:W. H. Freeman
Introduction to the Practice of Statistics
Statistics
ISBN:9781319013387
Author:David S. Moore, George P. McCabe, Bruce A. Craig
Publisher:W. H. Freeman
Hypothesis Testing using Confidence Interval Approach; Author: BUM2413 Applied Statistics UMP;https://www.youtube.com/watch?v=Hq1l3e9pLyY;License: Standard YouTube License, CC-BY
Hypothesis Testing - Difference of Two Means - Student's -Distribution & Normal Distribution; Author: The Organic Chemistry Tutor;https://www.youtube.com/watch?v=UcZwyzwWU7o;License: Standard Youtube License