Concept explainers
Videos
a.
Use a graphing utility to graph the cost function.
a.
Answer to Problem 71E

Explanation of Solution
Given information:
The cost
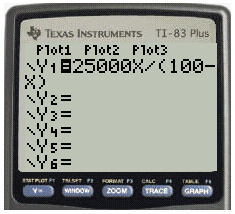
Use a graphing utility to graph the cost function.
Calculation:
Consider,
Press
Set the range button by pressing WINDOW,
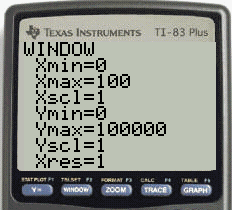
Press GRAPH button, to plot the graph
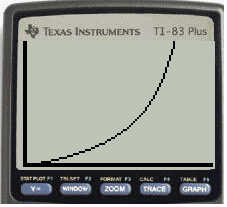
Hence, the solution is graph.
b.
Find the costs of supplying bins.
b.
Answer to Problem 71E
Explanation of Solution
Given information:
The cost
Find the costs of supplying bins to 15%, 50%, and 90% of the population.
Calculation:
Consider,
Substitute
Put,
Now put,
Hence, the solution is
c.
According to the model, would it be possible to supply bins to 100% of the population? Explain
c.
Answer to Problem 71E
No it is not possible.
Explanation of Solution
Given information:
The cost
According to the model, would it be possible to supply bins to 100% of the population? Explain.
Calculation:
No, would it be possible to supply bins to 100% of the population using the model because the expression for C becomes undefined as
Hence, the result is NO.
Chapter 2 Solutions
EBK PRECALCULUS W/LIMITS


 Calculus: Early TranscendentalsCalculusISBN:9781285741550Author:James StewartPublisher:Cengage Learning
 Thomas' Calculus (14th Edition)CalculusISBN:9780134438986Author:Joel R. Hass, Christopher E. Heil, Maurice D. WeirPublisher:PEARSON
 Calculus: Early Transcendentals (3rd Edition)CalculusISBN:9780134763644Author:William L. Briggs, Lyle Cochran, Bernard Gillett, Eric SchulzPublisher:PEARSON
 Calculus: Early TranscendentalsCalculusISBN:9781319050740Author:Jon Rogawski, Colin Adams, Robert FranzosaPublisher:W. H. Freeman
 Calculus: Early Transcendental FunctionsCalculusISBN:9781337552516Author:Ron Larson, Bruce H. EdwardsPublisher:Cengage Learning