Concept explainers
Videos
(a)
The graph of the function
(a)
Answer to Problem 78E
The graph is obtained along the negative axis.
Explanation of Solution
Given information:
The polynomial function is shown below,
Formula used:
The horizontal axis is x axis and the vertical axis is y axis.
Calculation:
The leading coefficient test says that: 1. If the degree of the polynomial is even and the leading coefficient is positive, both ends of the graph rise up 2. If the degree is even and the leading coefficient is negative, both ends of the graph fall down 3. If the degree is odd and the leading coefficient is positive, the left side of the graph falls down and the right side rises up 4. If the degree is odd and the leading coefficient is negative, the left side of the graph rises up and the right side falls down.
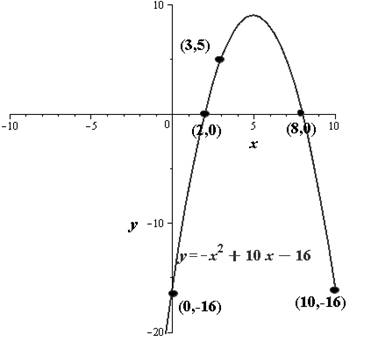
As the leading coefficient is negative and degree is even, both ends of the graph fall down. The ends of the graph would be in the direction as shown below:
Conclusion:
The graph is obtained along the negative axis.
(b)
The zeros of the polynomial.
(b)
Answer to Problem 78E
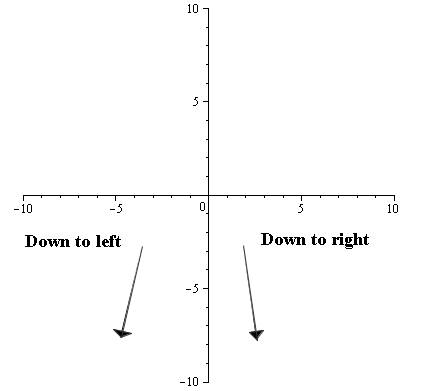
The zeros of the polynomial is 2, 8.
Explanation of Solution
Given information:
The polynomial function is shown below,
Formula used:
The polynomial is equated to zero.
Calculation:
Putting
Adding these points to the graph, and get
Conclusion:
The zeros of the polynomial is 2, 8.
(c)
The plotting sufficient solution points.
(c)
Answer to Problem 78E
The value gets increases and decreases continuously.
Explanation of Solution
Given information:
The polynomial function is shown below,
Formula used:
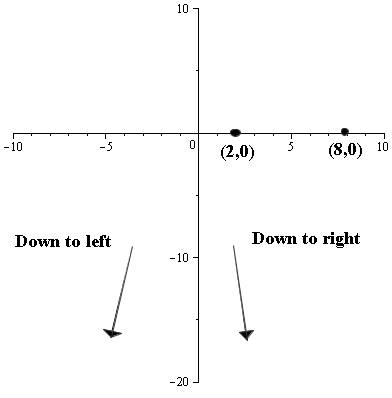
The test interval is determined by the values of the zeros.
Calculation:
The polynomial function is evaluated at the values chosen between the test intervals. And the test interval is determined by the values of the zeros. Consider the table of values shown below,
Conclusion:
The value gets increases and decreases continuously.
(d)
The continuous curve through the points.
(d)
Answer to Problem 78E
The graph cuts the x-axis at x = 2, 8.
Explanation of Solution
Given information:
The polynomial function is shown below,
Formula used:
The values are plotted against the x- axis and y-axis.
Calculation:
A continuous curve through the points obtained in the table is drawn. It is to be noted that as both the zeros are of odd multiplicity, the graph cuts the x-axis at x = 2, 8.
Conclusion:
The graph cuts the x-axis at x = 2, 8.
Chapter 2 Solutions
EBK PRECALCULUS W/LIMITS


 Calculus: Early TranscendentalsCalculusISBN:9781285741550Author:James StewartPublisher:Cengage Learning
 Thomas' Calculus (14th Edition)CalculusISBN:9780134438986Author:Joel R. Hass, Christopher E. Heil, Maurice D. WeirPublisher:PEARSON
 Calculus: Early Transcendentals (3rd Edition)CalculusISBN:9780134763644Author:William L. Briggs, Lyle Cochran, Bernard Gillett, Eric SchulzPublisher:PEARSON
 Calculus: Early TranscendentalsCalculusISBN:9781319050740Author:Jon Rogawski, Colin Adams, Robert FranzosaPublisher:W. H. Freeman
 Calculus: Early Transcendental FunctionsCalculusISBN:9781337552516Author:Ron Larson, Bruce H. EdwardsPublisher:Cengage Learning