
Elementary Statistics: A Step By Step Approach
10th Edition
ISBN: 9781259755330
Author: Allan G. Bluman
Publisher: McGraw-Hill Education
expand_more
expand_more
format_list_bulleted
Concept explainers
Videos
Textbook Question
Chapter 2.3, Problem 5E
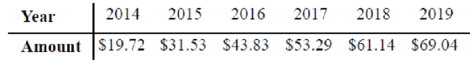
Online Ad Spending The amount spent (in billions of dollars) for ads online is shown. (The numbers for 2016 through 2019 are projected numbers.) Draw a time series graph and comment on the trend.
Expert Solution & Answer
Want to see the full answer?
Check out a sample textbook solution
Students have asked these similar questions
The table gives the yearly sales, S, of a retail store in years.
The following table gives the average monthly exchange rate between the U.S. dollar and the euro for 2009. It shows that 1 euro was equivalent to 1.289 U.S. dollars in January 2009. Develop a trend line that could be used to predict the exchange rate for 2010. Use this model to predict the exchange rate for January 2010 and February 2010. MONTH ______________________ EXCHANGE RATE January ....................................... 1.289 February ...................................... 1.324 March ......................................... 1.321 April .......................................... 1.317 May ........................................... 1.280 June ........................................... 1.254 July ........................................... 1.230 August ....................................... 1.240 September ................................... 1.287 October ..................................... 1.298 November .................................. 1.283 December…
In retail, a store manager uses time series models to understand shopping trends.
Review the scatter plot of the store’s sales from 2010 through 2021 to answer the questions. See attached as image.
Here is the data for Fiscal Year and Sales:
Fiscal Year
Sales
2010
$260,123.00
2011
$256,853.00
2012
$274,366.00
2013
$290,525.00
2014
$322,318.00
2015
$380,921.00
2016
$541,925.00
2017
$909,050.00
2018
$1,817,521.00
2019
$3,206,564.00
2020
$4,921,005.00
2021
$5,686,338.00
Time series decomposition seeks to separate the time series (Y) into 4 components: trend (T), cycle (C), seasonal (S), and irregular (I). What is the difference between these components?
The model can be additive or multiplicative. When do you use each?
Review the scatter plot of the exponential trend of the time series data. Do you observe a trend? If so, what type of trend do you observe?
What predictions might you make about the store’s annual sales over the next few years?
Chapter 2 Solutions
Elementary Statistics: A Step By Step Approach
Ch. 2.1 - Ages of Presidents at Inauguration The data...Ch. 2.1 - List five reasons for organizing data into a...Ch. 2.1 - Name the three types of frequency distributions,...Ch. 2.1 - How many classes should frequency distributions...Ch. 2.1 - What are open-ended frequency distributions? Why...Ch. 2.1 - For Exercises 58, find the class boundaries,...Ch. 2.1 - For Exercises 58, find the class boundaries,...Ch. 2.1 - For Exercises 58, find the class boundaries,...Ch. 2.1 - For Exercises 58, find the class boundaries,...Ch. 2.1 - For Exercises 912, show frequency distributions...
Ch. 2.1 - For Exercises 912, show frequency distributions...Ch. 2.1 - For Exercises 912, show frequency distributions...Ch. 2.1 - For Exercises 912, show frequency distributions...Ch. 2.1 - Favorite Coffee Flavor A survey was taken asking...Ch. 2.1 - Trust in Internet Information A survey was taken...Ch. 2.1 - Eating at Fast Food Restaurants A survey was taken...Ch. 2.1 - Ages of Dogs The ages of 20 dogs in a pet shelter...Ch. 2.1 - Maximum Wind Speeds The data show the maximum wind...Ch. 2.1 - Stories in the Worlds Tallest Buildings The number...Ch. 2.1 - Ages of Declaration of Independence Signers The...Ch. 2.1 - Salaries of Governors Here are the salaries (in...Ch. 2.1 - Charity Donations A random sample of 30 large...Ch. 2.1 - Unclaimed Expired Prizes The number of unclaimed...Ch. 2.1 - Scores in the Rose Bowl The data show the scores...Ch. 2.1 - Consumption of Natural Gas Construct a frequency...Ch. 2.1 - Average Wind Speeds A sample of 40 large cities...Ch. 2.1 - Percentage of People Who Completed 4 or More Years...Ch. 2.1 - JFK Assassination A researcher conducted a survey...Ch. 2.1 - The Value of Pi The ratio of the circumference of...Ch. 2.2 - Selling Real Estate Assume you are a realtor in...Ch. 2.2 - Do Students Need Summer Development? For 108...Ch. 2.2 - Bear Kills The number of bears killed in 2014 for...Ch. 2.2 - Pupils Per Teacher The average number of pupils...Ch. 2.2 - Number of College Faculty The number of faculty...Ch. 2.2 - Railroad Crossing Accidents The data show the...Ch. 2.2 - NFL Salaries The salaries (in millions of dollars)...Ch. 2.2 - Suspension Bridges Spans The following frequency...Ch. 2.2 - Costs of Utilities The frequency distribution...Ch. 2.2 - Air Pollution One of the air pollutants that is...Ch. 2.2 - Making the Grade The frequency distributions shown...Ch. 2.2 - Blood Glucose Levels The frequency distribution...Ch. 2.2 - Waiting Times The frequency distribution shows the...Ch. 2.2 - Construct a histogram, frequency polygon, and...Ch. 2.2 - Construct a histogram, frequency polygon, and...Ch. 2.2 - Construct a histogram, frequency polygon, and...Ch. 2.2 - Construct a histogram, frequency polygon, and...Ch. 2.2 - Home Runs The data show the most number of home...Ch. 2.2 - Protein Grams in Fast Food The amount of protein...Ch. 2.2 - Using the histogram shown here, do the following....Ch. 2.2 - Using the results from Exercise 19. answer these...Ch. 2.2 - Math SAT Scores Shown is an ogive depicting the...Ch. 2.3 - Applying the Concepts 23 Causes of Accidental...Ch. 2.3 - Tech Company Employees Construct a vertical and...Ch. 2.3 - Worldwide Sales of Fast Foods The worldwide sales...Ch. 2.3 - Gulf Coastlines Construct a Pareto chart for the...Ch. 2.3 - Roller Coaster Mania The World Roller Coaster...Ch. 2.3 - Online Ad Spending The amount spent (in billions...Ch. 2.3 - Violent Crimes The number of all violent crimes...Ch. 2.3 - U.S. Licensed Drivers 70 or Older Draw a time...Ch. 2.3 - Valentines Day Spending The data show the average...Ch. 2.3 - Credit Cards Draw and analyze a pie graph for the...Ch. 2.3 - Reasons We Travel The following data are based on...Ch. 2.3 - Kids and Guns The following data show where...Ch. 2.3 - Colors of Automobiles The popular car colors are...Ch. 2.3 - Ages of Football Players The data show the ages of...Ch. 2.3 - Teacher Strikes In Pennsylvania the numbers of...Ch. 2.3 - Years of Experience The data show the number of...Ch. 2.3 - Commuting Times Fifty off-campus students were...Ch. 2.3 - Home Run Club There are 43 Major League baseball...Ch. 2.3 - Calories in Salad Dressings A listing of calories...Ch. 2.3 - Length of Major Rivers The data show the lengths...Ch. 2.3 - Math and Reading Achievement Scores The math and...Ch. 2.3 - State which type of graph (Pareto chart, time...Ch. 2.3 - State which graph (Pareto chart, time series...Ch. 2.3 - U.S. Health Dollar The U.S. health dollar is spent...Ch. 2.3 - Prob. 24ECh. 2.3 - Cost of Milk The graph shows the increase in the...Ch. 2.3 - U.S. Population by Age The following information...Ch. 2.3 - Chicago Homicides Draw and compare two time series...Ch. 2.3 - Trip Reimbursements The average amount requested...Ch. 2 - How People Get Their News The Brunswick Research...Ch. 2 - Mens World Hockey Champions The United States won...Ch. 2 - BUN Count The blood urea nitrogen (BUN) count of...Ch. 2 - Wind Speed The data show the average wind speed...Ch. 2 - Waterfall Heights The data show the heights (in...Ch. 2 - Ages of the Vice Presidents at the Time of Their...Ch. 2 - Find the relative frequency for the frequency...Ch. 2 - Find the relative frequency for the frequency...Ch. 2 - Construct a histogram, frequency polygon, and...Ch. 2 - Construct a histogram, frequency polygon, and...Ch. 2 - Construct a histogram, frequency polygon, and...Ch. 2 - Construct a histogram, frequency polygon, and...Ch. 2 - Non-Alcoholic Beverages The data show the yearly...Ch. 2 - Calories of Nuts The data show the number of...Ch. 2 - Crime The data show the percentage of the types of...Ch. 2 - AID: 1825 | 31/5/2018 16. Pet Care The data (in...Ch. 2 - Broadway Stage Engagements The data show the...Ch. 2 - High School Dropout Rate The data show the high...Ch. 2 - Prob. 2.3.19RECh. 2 - Smart Phone Insurance Construct and analyze a pie...Ch. 2 - Prob. 2.3.21RECh. 2 - Prob. 2.3.22RECh. 2 - Weights of Football Players A local football team...Ch. 2 - Public Libraries The numbers of public libraries...Ch. 2 - Pain Relief The graph below shows the time it...Ch. 2 - Casino Payoffs The graph shows the payoffs...Ch. 2 - From the Data Bank located in Appendix B, choose...Ch. 2 - Prob. 2DACh. 2 - From the Data Bank, select at least 30 subjects...Ch. 2 - Prob. 4DACh. 2 - Using the data from Data Set XI in Appendix B,...Ch. 2 - Prob. 7DACh. 2 - Determine whether each statement is true or false....Ch. 2 - Prob. 2CQCh. 2 - Prob. 3CQCh. 2 - Frequency distributions can aid the researcher in...Ch. 2 - Determine whether each statement is true or false....Ch. 2 - Prob. 6CQCh. 2 - Determine whether each statement is true or false....Ch. 2 - Prob. 8CQCh. 2 - What are the boundaries for 8.68.8? a. 89 b....Ch. 2 - What graph should be used to show the relationship...Ch. 2 - Prob. 11CQCh. 2 - The three types of frequency distributions are...Ch. 2 - In a frequency distribution, the number of classes...Ch. 2 - Prob. 14CQCh. 2 - Data collected over a period of time can be...Ch. 2 - A statistical device used in exploratory data...Ch. 2 - On a Pareto chart, the frequencies should be...Ch. 2 - Housing Arrangements A questionnaire on housing...Ch. 2 - Housing Arrangements A questionnaire on housing...Ch. 2 - Prob. 20CQCh. 2 - Construct a histogram, a frequency polygon, and an...Ch. 2 - Coal Consumption The following data represent the...Ch. 2 - Construct a histogram, frequency polygon, and...Ch. 2 - Recycled Trash Construct a Pareto chart and a...Ch. 2 - Identity Thefts The results of a survey of 84...Ch. 2 - Needless Deaths of Children The New England...Ch. 2 - Prob. 27CQCh. 2 - Parking Meter Revenue In a small city the number...Ch. 2 - Prob. 29CQCh. 2 - The Great Lakes Shown are various statistics about...Ch. 2 - Teacher Strikes In Pennsylvania there were more...
Knowledge Booster


Learn more about
Need a deep-dive on the concept behind this application? Look no further. Learn more about this topic, statistics and related others by exploring similar questions and additional content below.Similar questions
- Total spending on health care in a certain region rose from $881 million in 1977 to $941 billion in 2007. Compare this rise in health care spending to the overall rate of inflation as measured by the Consumer Price Index. Click the icon to view the Average Annual Consumer Price Index. Health care spending increased by %. (Round to the nearest percent as needed.) Average Annual Consumer Price Index (1982-1984-100 Year CPI Year CPI Year CPI 1976 56.9 1987 113.6 1998 163.0 166.6 1977 60.6 1988 118.3 1999 1978 65.2 1989 124.0 2000 172.2 130.7 136.2 2001 2002 1979 72.6 1990 177.1 1980 1981 82.4 1991 179.9 140.3 2003 2004 90.9 1992 184.0 144.5 148.2 188.9 195.3 201.6 1982 96.5 1993 99.6 103.9 2005 2006 1983 1994 1984 1995 152.4 2007 207.3 2008 215.3 1996 156.9 107.6 109.6 1985 1986 1997 160.5 Print Done Enter your answer in the answer box and then click Check Answer.arrow_forwardThe accompanying data represent health care expenditures per capita (per person) as a percentage of the U.S. gross domestic product (GDP) from 2007 to 2013. Gross domestic product is the total value of all goods and services created during the course of the year Complete parts (a) through (c) below. Click the icon to view the data table. (a) Construct a time-series plot that a politician would create to support the position that health care expenditures are increasing and must be slowed. Choose the correct graph below OD. O C. OB OA A Q A Q Q 25,000+ 11,000 Q Q 3 2 G HIER 11200 2H 7,000++ C 2013 of + 2013 2007 2007 Year Year Year (b) Construct a time-series plot that the health care industry would create to refute the opinion of the politician. Choose the correct graph below. OB. O C. O A. A Q A Q 11,000 Q (C) 7,000+ 201 20 7.000+++++++* 2007 2007 2013 2013 Year Year (c) Explain how different measures may be used to support two completely different positions. Choose the correct answer…arrow_forwardThe following table is a selection of average prices for a gallon of gas in the United States. Year Gas Price Index Value 2000 $1.48 [A] 2006 $2.57 [B] 2008 $3.25 [C] 2012 $3.62 [D] Build an index from these values, using 2008 as the base year. Round each index value to the nearest tenth. [A] = [B] = [C] = [D] =arrow_forward
- The creator of a new online multiplayer survival game has been tracking the monthly downloads of the game. The following table shows the monthly downloads (in thousands) for each month of the current and previous year. Click on the datafile logo to reference the data. Month Downloads Month Downloads (previous year) (thousands) (current year) (thousands) February 33.0 January 37.0 March 34.0 February 35.0 April 34.0 March 37.0 May 32.0 April 38.0 June 32.0 May 35.0 July 35.0 June 36.0 August 35.0 July 35.0 September 37.0 August 35.0 October 37.0 September 34.0 November 36.0 October 31.0 December 34.0 Compute the mean, median, and mode for number of downloads in the previous year. Mean (to 3 decimals) thousand Median (to 2 decimal) thousand Mode (to 2 decimal) thousand…arrow_forwardFind the rates of change.arrow_forwardThe following chart shows "living wage" jobs in Rochester per 1000 working age adults over a 5 year period. Year 2016 2017 2018 2019 2020 Jobs 650 705 750 785 805 What is the average rate of change in the number of living wage jobs from 2016 to 2018? Jobs/Year What is the average rate of change in the number of living wage jobs from 2018 to 2020? Jobs/Year Question Help: Video Message instructor Submit Questionarrow_forward
arrow_back_ios
arrow_forward_ios
Recommended textbooks for you
 Glencoe Algebra 1, Student Edition, 9780079039897...AlgebraISBN:9780079039897Author:CarterPublisher:McGraw Hill
 College AlgebraAlgebraISBN:9781305115545Author:James Stewart, Lothar Redlin, Saleem WatsonPublisher:Cengage Learning
 Big Ideas Math A Bridge To Success Algebra 1: Stu...AlgebraISBN:9781680331141Author:HOUGHTON MIFFLIN HARCOURTPublisher:Houghton Mifflin Harcourt
 College Algebra (MindTap Course List)AlgebraISBN:9781305652231Author:R. David Gustafson, Jeff HughesPublisher:Cengage Learning
Glencoe Algebra 1, Student Edition, 9780079039897...
Algebra
ISBN:9780079039897
Author:Carter
Publisher:McGraw Hill
College Algebra
Algebra
ISBN:9781305115545
Author:James Stewart, Lothar Redlin, Saleem Watson
Publisher:Cengage Learning
Big Ideas Math A Bridge To Success Algebra 1: Stu...
Algebra
ISBN:9781680331141
Author:HOUGHTON MIFFLIN HARCOURT
Publisher:Houghton Mifflin Harcourt
College Algebra (MindTap Course List)
Algebra
ISBN:9781305652231
Author:R. David Gustafson, Jeff Hughes
Publisher:Cengage Learning
Use of ALGEBRA in REAL LIFE; Author: Fast and Easy Maths !;https://www.youtube.com/watch?v=9_PbWFpvkDc;License: Standard YouTube License, CC-BY
Compound Interest Formula Explained, Investment, Monthly & Continuously, Word Problems, Algebra; Author: The Organic Chemistry Tutor;https://www.youtube.com/watch?v=P182Abv3fOk;License: Standard YouTube License, CC-BY
Applications of Algebra (Digit, Age, Work, Clock, Mixture and Rate Problems); Author: EngineerProf PH;https://www.youtube.com/watch?v=Y8aJ_wYCS2g;License: Standard YouTube License, CC-BY