
Concept explainers
Videos
(a)
To find: what sampling style is expected to be used by the magazine.
(a)
Explanation of Solution
Here, the magazine will split the entire population into two strata, American car owners and Japanese car owners, and then pick 450 American car owners and 450 Japanese car owners. So, the magazine aims to use the design of stratified sampling.
(b)
To find: what difference their poll would expect to reveal.
(b)
Answer to Problem 8E
2 percent
Explanation of Solution
78%- 76%= 2%.
Since there is a 2% gap, it is predicted the poll to display a gap of 2 percent.
(c)
To find: the standard deviation for the proportion difference.
(c)
Answer to Problem 8E
3 percent
Explanation of Solution
Given:
Formula used:
Calculation:
Estimated the standard deviation of the gap with
For the difference in the proportions, the standard deviation is 3%.
(d)
To construct: a model of sampling for the difference in proportions that may occur in such a poll.
(d)
Explanation of Solution
The sampling distribution of
Using the
Graph:
The distribution model graph:
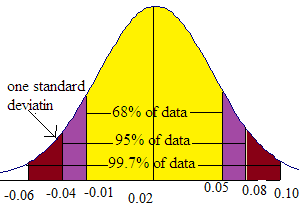
They indicate that nearly 68% of the observations will have a difference in proportion between -0.01 and 0.05, nearly 85% of the observations will have a difference in proportion between -0.04 and 0.08, and nearly 99.7% of the observations will have a difference in proportion between -0.06 and 0.10.
(e)
To explain: that the poll misled the paper, concluding that American car owners are much happier with their cars than Japanese car owners.
(e)
Explanation of Solution
Yes, if the sample ratio gap is just one-two standard deviations underneath the mean, then the survey could mislead the campaign, indicating that American car owners are much satisfied with their cars than Japanese car owners.
Chapter 22 Solutions
Stats: Modeling the World Nasta Edition Grades 9-12
Additional Math Textbook Solutions
Statistics for Psychology
Intro Stats
Introductory Statistics
Introductory Statistics
Introductory Statistics (10th Edition)
An Introduction to Mathematical Statistics and Its Applications (6th Edition)


 MATLAB: An Introduction with ApplicationsStatisticsISBN:9781119256830Author:Amos GilatPublisher:John Wiley & Sons Inc
 Probability and Statistics for Engineering and th...StatisticsISBN:9781305251809Author:Jay L. DevorePublisher:Cengage Learning
 Statistics for The Behavioral Sciences (MindTap C...StatisticsISBN:9781305504912Author:Frederick J Gravetter, Larry B. WallnauPublisher:Cengage Learning
 Elementary Statistics: Picturing the World (7th E...StatisticsISBN:9780134683416Author:Ron Larson, Betsy FarberPublisher:PEARSON
 The Basic Practice of StatisticsStatisticsISBN:9781319042578Author:David S. Moore, William I. Notz, Michael A. FlignerPublisher:W. H. Freeman
 Introduction to the Practice of StatisticsStatisticsISBN:9781319013387Author:David S. Moore, George P. McCabe, Bruce A. CraigPublisher:W. H. Freeman