
Concept explainers
Videos
(a)
To find: the sampling style of what his employees are planning to use.
(a)
Explanation of Solution
Here, workers will divide the entire population into two strata, males and females, and then pick 300 males from the male stratum and 300 females from the female stratum. So, his workers are preparing to use the design of stratified sampling.
(b)
To find: the difference that the poll will expect to reveal.
(b)
Answer to Problem 7E
6 percent difference
Explanation of Solution
59% -53% =6%. Since there is 6 percent difference. The poll is predicted to show a gap of 6 per cent.
(c)
To find: The standard deviation for the proportional difference.
(c)
Answer to Problem 7E
4 percent
Explanation of Solution
Given:
Formula used:
Calculation:
Estimating the standard deviation of difference with
4% is the standard deviation for the difference in the proportion.
(d)
To Construct: the sampling model for the differences in size in the proportions of men and women with his candidate's favourable perceptions that may occur in a survey like this.
(d)
Explanation of Solution
The sampling distribution of
And standard deviation
Using the
Graph:
Below, the distribution model is shown.
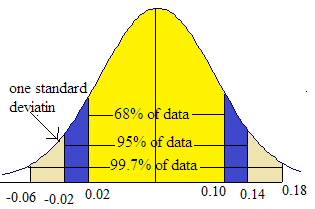
They indicate that nearly 68% of the observations would have a difference in proportion between 0.02 and 0.10, approximately 95% of the observations would have a difference in proportion between -0.02 and 0.14, and roughly 99.7% of the observations would have a difference in proportion between -0.06 and 0.18.
(e)
To explain: The poll misleads the campaign, concluding that there is actually no gender difference.
(e)
Answer to Problem 7E
Yes
Explanation of Solution
Yes, if the gap in the sample proportion is just one or two standard deviations below the mean, then the poll could mislead the campaign, concluding that there is actually no gender gap.
Chapter 22 Solutions
Stats: Modeling the World Nasta Edition Grades 9-12
Additional Math Textbook Solutions
Statistics for Business and Economics (13th Edition)
Statistical Reasoning for Everyday Life (5th Edition)
Statistics for Psychology
STATS:DATA+MODELS-W/DVD
Essentials of Statistics (6th Edition)


 MATLAB: An Introduction with ApplicationsStatisticsISBN:9781119256830Author:Amos GilatPublisher:John Wiley & Sons Inc
 Probability and Statistics for Engineering and th...StatisticsISBN:9781305251809Author:Jay L. DevorePublisher:Cengage Learning
 Statistics for The Behavioral Sciences (MindTap C...StatisticsISBN:9781305504912Author:Frederick J Gravetter, Larry B. WallnauPublisher:Cengage Learning
 Elementary Statistics: Picturing the World (7th E...StatisticsISBN:9780134683416Author:Ron Larson, Betsy FarberPublisher:PEARSON
 The Basic Practice of StatisticsStatisticsISBN:9781319042578Author:David S. Moore, William I. Notz, Michael A. FlignerPublisher:W. H. Freeman
 Introduction to the Practice of StatisticsStatisticsISBN:9781319013387Author:David S. Moore, George P. McCabe, Bruce A. CraigPublisher:W. H. Freeman