
Concept explainers
Videos
a.
To graph the given data
a.
Explanation of Solution
Given information:
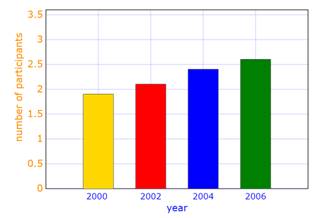
| Year | Number of participants(millions) |
| 2000 | 1.9 |
| 2002 | 2.1 |
| 2004 | 2.4 |
| 2006 | 2.6 |
Graph:
b.
To evaluate the conjecture.
b.
Answer to Problem 39PPS
The conjection is every year participants increase by 0.2(millions) from the table.
The conjection is every year participants increase by 0.12(millions) from the graph.
Explanation of Solution
Given information:
| Year | Number of participants(millions) |
| 2000 | 1.9 |
| 2002 | 2.1 |
| 2004 | 2.4 |
| 2006 | 2.6 |

Formula used:
Formula of slope is,
Calculation:
From the table, every year the number of participants increase by 0.2 (millions) from the number of participants from the previous number of participants.
Hence, the conjection is every year participants increase by 0.2(millions)
From graph, substituting the values in slope formula,
So,
On solving,
Hence, the conjection is every year participants increase by 0.12(millions) from the graph.
Chapter 2 Solutions
Geometry, Student Edition
Additional Math Textbook Solutions
A First Course in Probability
Elementary Statistics
Linear Algebra and Its Applications (5th Edition)
Finite Mathematics & Its Applications (12th Edition)
Probability and Statistics for Engineers and Scientists


 Elementary Geometry For College Students, 7eGeometryISBN:9781337614085Author:Alexander, Daniel C.; Koeberlein, Geralyn M.Publisher:Cengage,
 Elementary Geometry for College StudentsGeometryISBN:9781285195698Author:Daniel C. Alexander, Geralyn M. KoeberleinPublisher:Cengage Learning