a.
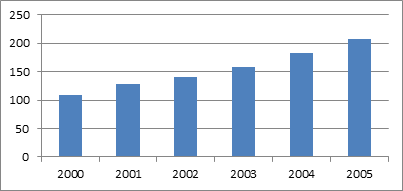
To graph the given data
a.
Explanation of Solution
Given information:
| Year | Subscription(millions) |
| 2000 | 109.5 |
| 2001 | 128.4 |
| 2002 | 140.8 |
| 2003 | 158.7 |
| 2004 | 182.1 |
| 2005 | 207.9 |
Graph:

b.
To evaluate the conjecture
b.
Answer to Problem 11CYU
For 2010 the subscription of mobile phones is 245.9(millions)
Explanation of Solution
Given information:
| Year | Subscription(millions) |
| 2000 | 109.5 |
| 2001 | 128.4 |
| 2002 | 140.8 |
| 2003 | 158.7 |
| 2004 | 182.1 |
| 2005 | 207.9 |
Formula used:
Arthimetic sequence formula is,
Calculation:
In the given data, each year the subscription of phones increases by 12.4 millions from the previous year.
For the given data, arithemetic sequence formula is,
For 2010,
So,
On solving,
Hence, for 2010 the subscription of mobile phones is 245.9(millions)
Chapter 2 Solutions
Geometry, Student Edition
Additional Math Textbook Solutions
Basic Business Statistics, Student Value Edition
Algebra and Trigonometry (6th Edition)
Elementary Statistics (13th Edition)
Elementary Statistics: Picturing the World (7th Edition)
Introductory Statistics
College Algebra with Modeling & Visualization (5th Edition)
 Elementary Geometry For College Students, 7eGeometryISBN:9781337614085Author:Alexander, Daniel C.; Koeberlein, Geralyn M.Publisher:Cengage,
 Elementary Geometry for College StudentsGeometryISBN:9781285195698Author:Daniel C. Alexander, Geralyn M. KoeberleinPublisher:Cengage Learning

