
To calculate: The thermocline depth and the flux across the interface by the use of a cubic spline fit where
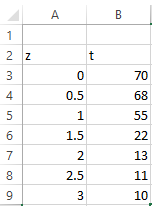
| Depth, m | 0 | 0.5 | 1.0 | 1.5 | 2.0 | 2.5 | 3.0 |
| Temperature, Celsius | 70 | 68 | 55 | 22 | 13 | 11 | 10 |
The provided graph shows the relationship between depth and temperature as,

Answer to Problem 6P
Solution:
The value of thermocline depth and the flux across the interface is
Explanation of Solution
Given Information:
The table is given as,
| Depth, m | 0 | 0.5 | 1.0 | 1.5 | 2.0 | 2.5 | 3.0 |
| Temperature, Celsius | 70 | 68 | 55 | 22 | 13 | 11 | 10 |
The provided graph shows the relationship between depth and temperature as,
Calculation:
Consider the Fourier’s law,
The value of
From the graph, this can be interpreted that curve has zero slope at
Since, the cubic spline fit is required, so this problem can be solved by the Excel VBA(Visual Basic for applications). The steps are,
Step 1. Insert the data in excel as shown below,
Step 2. Press ALT+F11 and write the code as shown below,
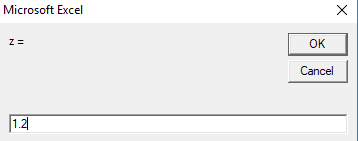
Step 3. Press RUN then this dialog box appears.

Step 4. Enter the value of z.
Step 5. This output will appear.
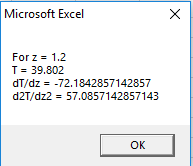
Thus, the value of
Hence, the value of thermocline depth and the flux across the interface is
Want to see more full solutions like this?
Chapter 20 Solutions
Numerical Methods for Engineers

- A stamped sheet steel plate is shown in Figure 164. Compute dimensions AF to 3 decimal places. All dimensions are in inches. A=_B=_C=_D=_E=_F=_arrow_forwardTsunami Waves and BreakwatersThis is a continuation of Exercise 16. Breakwaters affect wave height by reducing energy. See Figure 5.30. If a tsunami wave of height H in a channel of width W encounters a breakwater that narrows the channel to a width w, then the height h of the wave beyond the breakwater is given by h=HR0.5, where R is the width ratio R=w/W. a. Suppose a wave of height 8 feet in a channel of width 5000feet encounters a breakwater that narrows the channel to 3000feet. What is the height of the wave beyond the breakwater? b. If a channel width is cut in half by a breakwater, what is the effect on wave height? 16. Height of Tsunami WavesWhen waves generated by tsunamis approach shore, the height of the waves generally increases. Understanding the factors that contribute to this increase can aid in controlling potential damage to areas at risk. Greens law tells how water depth affects the height of a tsunami wave. If a tsunami wave has height H at an ocean depth D, and the wave travels to a location with water depth d, then the new height h of the wave is given by h=HR0.25, where R is the water depth ratio given by R=D/d. a. Calculate the height of a tsunami wave in water 25feet deep if its height is 3feet at its point of origin in water 15,000feet deep. b. If water depth decreases by half, the depth ratio R is doubled. How is the height of the tsunami wave affected?arrow_forwardFind the intensities of earthquakes whose magnitudes are (a) R=6.0 and (b) R=7.9.arrow_forward
- At Chairs and More, assemblers are apud according to the following differential piece rate scale 1-25 chairs in a week, $10 each; 26-40 chairs in a week $13 each; 40 up chairs in a week $17.50. Salina Grant assembled 47 chairs in one week. Find her gross pay.arrow_forwardSuppose leaf biomass L (kg) and root biomass R (kg) are related by L=R^b x α Suppose two plants yield the following data: plant 1 has root biomass 10 and leaf biomass 1 while plant 2 has root biomass 0.001 and leaf biomass 0.001. Given this information, find the values of α and βarrow_forward(b) Find a linear model using the first and last data points. (Use x for income measured in dollars and y for ulcers per 100 people. Round your values to eight decimal places.)arrow_forward
- Given this equation for converting temperature from Celsius (c) to Fahrenheit (f): f = (9/5)c + 32arrow_forwardThe data given below indicate the existence of a linear relationship between the x and y variables. Suppose an analyst who prepared the solutions and carried out the RI measurements was not skilled and as a result of poor technique, allowed intermediate errors to appear. The results are the following:Concentration of solution in percent (x) 10 26 33 50 61Refractive indices (y) 1.497 1.493 1.485 1.478 1.477Step 1. Carefully plot the given x and y values (from the table) on a regular graphing paper. Label then connect the points to observe a zigzag plot due to the scattered points. Step 2: Copy and fill the table given below: x (x - x̄) (x - x̄) 2 y (y - ȳ) (y - ȳ) 2 (x - x̄) (y - ȳ) 10 1.497 26 1.49333 1.48550 1.47861 1.477∑ = ∑ = ∑ = ∑ = ∑ = ∑ = ∑ =x̄= ∑xi ÷ Nx̄= ȳ = ∑yi ÷ Nȳ = Step 3. After completing the table, present following computations and the interpretation.a. Calculate the correlation coefficient (r), using the working formula: r =Σ (x − x ) (y − ȳ)√(Σ(x − x )2)(Σ(y −…arrow_forwardFind the temperature of the bar for any position at any time. What will be the steady state temperature distribution.arrow_forward
 Algebra & Trigonometry with Analytic GeometryAlgebraISBN:9781133382119Author:SwokowskiPublisher:Cengage
 Functions and Change: A Modeling Approach to Coll...AlgebraISBN:9781337111348Author:Bruce Crauder, Benny Evans, Alan NoellPublisher:Cengage Learning
 Mathematics For Machine TechnologyAdvanced MathISBN:9781337798310Author:Peterson, John.Publisher:Cengage Learning,
 Algebra: Structure And Method, Book 1AlgebraISBN:9780395977224Author:Richard G. Brown, Mary P. Dolciani, Robert H. Sorgenfrey, William L. ColePublisher:McDougal Littell