
Introductory Statistics (2nd Edition)
2nd Edition
ISBN: 9780321978271
Author: Robert Gould, Colleen N. Ryan
Publisher: PEARSON
expand_more
expand_more
format_list_bulleted
Concept explainers
Videos
Textbook Question
Chapter 2, Problem 3SE
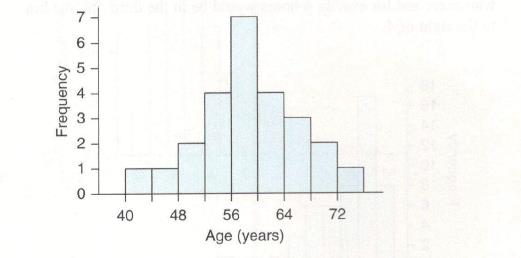
Ages of CEOs The histogram shows frequencies for the ages of 25 CEOs listed at Forbes.com. Convert this histogram to one showing relative frequencies by relabeling the vertical axis,
With the appropriate relative frequencies. You may just report the new labels for the vertical axis. Because that is the only thing that
Expert Solution & Answer
Want to see the full answer?
Check out a sample textbook solution
Students have asked these similar questions
(b) In various places in this module, data on the silver content of coins
minted in the reign of the twelfth-century Byzantine king Manuel I
Comnenus have been considered. The full dataset is in the Minitab file
coins.mwx. The dataset includes, among others, the values of the
silver content of nine coins from the first coinage (variable Coin1) and
seven from the fourth coinage (variable Coin4) which was produced a
number of years later. (For the purposes of this question, you can
ignore the variables Coin2 and Coin3.) In particular, in Activity 8 and
Exercise 2 of Computer Book B, it was argued that the silver contents
in both the first and the fourth coinages can be assumed to be normally
distributed. The question of interest is whether there were differences in
the silver content of coins minted early and late in Manuel’s reign. You
are about to investigate this question using a two-sample t-interval.
(i) Using Minitab, find either the sample standard deviations of the
two variables…
Homework Let X1, X2, Xn be a random sample from f(x;0) where
f(x; 0) = (-), 0 < x < ∞,0 € R
Using Basu's theorem, show that Y = min{X} and Z =Σ(XY) are indep.
-
Homework Let X1, X2, Xn be a random sample from f(x; 0) where
f(x; 0) = e−(2-0), 0 < x < ∞,0 € R
Using Basu's theorem, show that Y = min{X} and Z =Σ(XY) are indep.
Chapter 2 Solutions
Introductory Statistics (2nd Edition)
Ch. 2 - Body Mass Index The Dotplot shows body mass index...Ch. 2 - Cholesterol Levels The dotplot shows the...Ch. 2 - Ages of CEOs The histogram shows frequencies for...Ch. 2 - Sleep Hours The relative frequency histogram shows...Ch. 2 - Televisions (Example 1) The histogram shows the...Ch. 2 - Exercise Hours The histogram shows the...Ch. 2 - Shoes The graph is a dotplot of the number of...Ch. 2 - Condo Rental The dotplot shows rental prices per...Ch. 2 - Speeding Tickets (Example 2) A teacher asks 90...Ch. 2 - Breakfast Predict the shape of the distribution of...
Ch. 2 - Arm spans (Example 3) According to the ancient...Ch. 2 - Tuition The distribution of in-state annual...Ch. 2 - Ages of CEOs (Example 4) From the histogram in...Ch. 2 - Sleep Hours From the histogram shown in Exercise...Ch. 2 - Commute Times (Example 5) Use the histograms to...Ch. 2 - Spending on Clothes The histograms show the...Ch. 2 - Education (Example 6) In 2012, the General Social...Ch. 2 - Siblings The histogram shows the distribution of...Ch. 2 - Years of Education The GSS asked people how many...Ch. 2 - Hours Worked In the 2012 General Social Survey,...Ch. 2 - Matching Histograms match each of the following...Ch. 2 - Matching Histograms Match each of the following...Ch. 2 - Matching Match each description with the correct...Ch. 2 - Matching Match each description with the correct...Ch. 2 - Eating Out and jobs College students Jacqueline...Ch. 2 - Comparing Weights of Baseball and Soccer Players...Ch. 2 - Textbook Prices The table shows prices of 50...Ch. 2 - SAT scores The following table shows a random...Ch. 2 - Animal Longevity The following table in Exercise...Ch. 2 - Animal Gestation Periods The accompanying table...Ch. 2 - Tax Rate A StatCrunch survey asked people what...Ch. 2 - Pets A StatCrunch survey asked people whether they...Ch. 2 - Law School Tuition Data are shown for the cost of...Ch. 2 - Text Messages Recently, 115 users of StatCrunch...Ch. 2 - Beer, Calories Data are available on the number of...Ch. 2 - Beer, Alcohol Data are available on the percent...Ch. 2 - Changing Multiple-Choice Answers When Told Not to...Ch. 2 - Preventable Deaths According to the World Health...Ch. 2 - U.S. Distribution of wealth (Example 8) Michael...Ch. 2 - Education The graph shows the education of...Ch. 2 - Political Party Affiliation: Men The 2012 General...Ch. 2 - Political Party Affiliation Women The 2012 General...Ch. 2 - Prob. 43SECh. 2 - Retail Car Sales With gas prices rising, as they...Ch. 2 - Majors The table gives information on college...Ch. 2 - Adoptions The table gives information on the top...Ch. 2 - Garage The accompanying graph shows the...Ch. 2 - Body Image A student has gathered data on...Ch. 2 - Pie Chart of Sleep Hours The pie chart reports the...Ch. 2 - Age and Gender The following graph shows the ages...Ch. 2 - Musicians Survey: StatCrunch Graph The...Ch. 2 - Cell Phone Use Refer to the accompanying bar...Ch. 2 - Television The table shows the first few entries...Ch. 2 - Job The table shows the job categories for some...Ch. 2 - Hormone Replacement Therapy The use of the drug...Ch. 2 - E-Music The bar graph shows information reported...Ch. 2 - Hormone Replacement Therapy Again The following...Ch. 2 - Holding Your Breath A group of students held their...Ch. 2 - Global Temperatures The histograms show the...Ch. 2 - Employment after Law School Accredited law schools...Ch. 2 - Position for Breathing The graph shows the results...Ch. 2 - Opinions on Global Warming People were asked...Ch. 2 - Create a dotplot that has at least 10 observations...Ch. 2 - Create a dotplot that has at least 10 observations...Ch. 2 - Traffic Cameras College students Jeannette Mujica,...Ch. 2 - Ideal Weight Thirty-nine students (26 women and 13...Ch. 2 - MPH The graphs show the distribution of...Ch. 2 - Shoe Sizes The graph shows shoe sizes for men and...Ch. 2 - CEO Salaries Predict the shape of the distribution...Ch. 2 - Cigarettes A physician asks all of his patients to...Ch. 2 - Changing Multiple-Choice Answers When Told to Do...Ch. 2 - ER Visits for Injuries The graph shows the rates...
Knowledge Booster


Learn more about
Need a deep-dive on the concept behind this application? Look no further. Learn more about this topic, statistics and related others by exploring similar questions and additional content below.Similar questions
- An Arts group holds a raffle. Each raffle ticket costs $2 and the raffle consists of 2500 tickets. The prize is a vacation worth $3,000. a. Determine your expected value if you buy one ticket. b. Determine your expected value if you buy five tickets. How much will the Arts group gain or lose if they sell all the tickets?arrow_forwardPlease show as much work as possible to clearly show the steps you used to find each solution. If you plan to use a calculator, please be sure to clearly indicate your strategy. Consider the following game. It costs $3 each time you roll a six-sided number cube. If you roll a 6 you win $15. If you roll any other number, you receive nothing. a) Find the expected value of the game. b) If you play this game many times, will you expect to gain or lose money?arrow_forward= 12:02 WeBWorK / 2024 Fall Rafeek MTH23 D02 / 9.2 Testing the Mean mu / 3 38 WEBWORK Previous Problem Problem List Next Problem 9.2 Testing the Mean mu: Problem 3 (1 point) Test the claim that the population of sophomore college students has a mean grade point average greater than 2.2. Sample statistics include n = 71, x = 2.44, and s = 0.9. Use a significance level of a = 0.01. The test statistic is The P-Value is between : The final conclusion is < P-value < A. There is sufficient evidence to support the claim that the mean grade point average is greater than 2.2. ○ B. There is not sufficient evidence to support the claim that the mean grade point average is greater than 2.2. Note: You can earn partial credit on this problem. Note: You are in the Reduced Scoring Period. All work counts for 50% of the original. Preview My Answers Submit Answers You have attempted this problem 0 times. You have unlimited attempts remaining. . Oli wwm01.bcc.cuny.eduarrow_forward
- There are four white, fourteen blue and five green marbles in a bag. A marble is selected from the bag without looking. Find the odds of the following: The odds against selecting a green marble. The odds in favour of not selecting a green marble The odds in favor of the marble selected being either a white or a blue marble. What is true about the above odds? Explainarrow_forwardPlease show as much work as possible to clearly show the steps you used to find each solution. If you plan to use a calculator, please be sure to clearly indicate your strategy. 1. The probability of a soccer game in a particular league going into overtime is 0.125. Find the following: a. The odds in favour of a game going into overtime. b. The odds in favour of a game not going into overtime. c. If the teams in the league play 100 games in a season, about how many games would you expect to go into overtime?arrow_forwardexplain the importance of the Hypothesis test in a business setting, and give an example of a situation where it is helpful in business decision making.arrow_forward
- A college wants to estimate what students typically spend on textbooks. A report fromthe college bookstore observes that textbooks range in price from $22 to $186. Toobtain a 95% confidence level for a confidence interval estimate to plus or minus $10,how many students should the college survey? (We may estimate the populationstandard deviation as (range) ÷ 4.)arrow_forwardIn a study of how students give directions, forty volunteers were given the task ofexplaining to another person how to reach a destination. Researchers measured thefollowing five aspects of the subjects’ direction-giving behavior:• whether a map was available or if directions were given from memory without a map,• the gender of the direction-giver,• the distances given as part of the directions,• the number of times directions such as “north” or “left” were used,• the frequency of errors in directions. Identify each of the variables in this study, and whether each is quantitative orqualitative. For each quantitative variable, state whether it is discrete or continuous. Was this an observational study or an experimental study? Explain your answer.arrow_forwardexplain the difference between the confident interval and the confident level. provide an example to show how to correctly interpret a confidence interval.arrow_forward
- Sketch to scale the orbit of Earth about the sun. Graph Icarus’ orbit on the same set of axesWhile the sun is the center of Earth’s orbit, it is a focus of Icarus’ orbit. There aretwo points of intersection on the graph. Based on the graph, what is the approximate distance between the two points of intersection (in AU)?arrow_forwardThe diameters of ball bearings are distributed normally. The mean diameter is 67 millimeters and the standard deviation is 3 millimeters. Find the probability that the diameter of a selected bearing is greater than 63 millimeters. Round to four decimal places.arrow_forwardSuppose you like to keep a jar of change on your desk. Currently, the jar contains the following: 22 Pennies 27 Dimes 9 Nickels 30 Quarters What is the probability that you reach into the jar and randomly grab a penny and then, without replacement, a dime? Express as a fraction or a decimal number rounded to four decimal places.arrow_forward
arrow_back_ios
SEE MORE QUESTIONS
arrow_forward_ios
Recommended textbooks for you
 Glencoe Algebra 1, Student Edition, 9780079039897...AlgebraISBN:9780079039897Author:CarterPublisher:McGraw Hill
 Big Ideas Math A Bridge To Success Algebra 1: Stu...AlgebraISBN:9781680331141Author:HOUGHTON MIFFLIN HARCOURTPublisher:Houghton Mifflin Harcourt
 Holt Mcdougal Larson Pre-algebra: Student Edition...AlgebraISBN:9780547587776Author:HOLT MCDOUGALPublisher:HOLT MCDOUGAL
Glencoe Algebra 1, Student Edition, 9780079039897...
Algebra
ISBN:9780079039897
Author:Carter
Publisher:McGraw Hill
Big Ideas Math A Bridge To Success Algebra 1: Stu...
Algebra
ISBN:9781680331141
Author:HOUGHTON MIFFLIN HARCOURT
Publisher:Houghton Mifflin Harcourt
Holt Mcdougal Larson Pre-algebra: Student Edition...
Algebra
ISBN:9780547587776
Author:HOLT MCDOUGAL
Publisher:HOLT MCDOUGAL
Correlation Vs Regression: Difference Between them with definition & Comparison Chart; Author: Key Differences;https://www.youtube.com/watch?v=Ou2QGSJVd0U;License: Standard YouTube License, CC-BY
Correlation and Regression: Concepts with Illustrative examples; Author: LEARN & APPLY : Lean and Six Sigma;https://www.youtube.com/watch?v=xTpHD5WLuoA;License: Standard YouTube License, CC-BY