
Introductory Statistics (2nd Edition)
2nd Edition
ISBN: 9780321978271
Author: Robert Gould, Colleen N. Ryan
Publisher: PEARSON
expand_more
expand_more
format_list_bulleted
Concept explainers
Videos
Textbook Question
Chapter 2, Problem 30SE
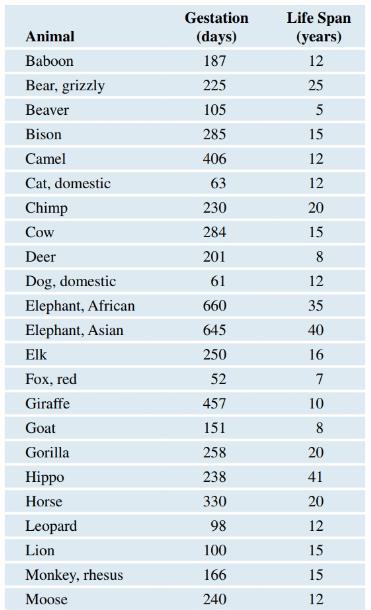
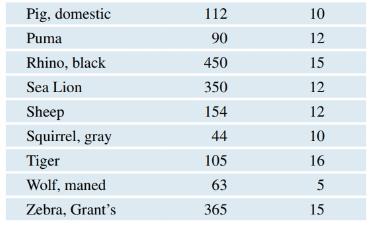
Animal Gestation Periods The accompanying table also shows the gestation period (in days) for some animals. The gestation period is the length of pregnancy. Graph the gestation period and describe the distribution. If there are any outliers, identify the animal(s) and give the gestation periods. If you were to include humans in this graph, where would the data point be? The human gestation period is about 266 days.
Expert Solution & Answer
Want to see the full answer?
Check out a sample textbook solution
Chapter 2 Solutions
Introductory Statistics (2nd Edition)
Ch. 2 - Body Mass Index The Dotplot shows body mass index...Ch. 2 - Cholesterol Levels The dotplot shows the...Ch. 2 - Ages of CEOs The histogram shows frequencies for...Ch. 2 - Sleep Hours The relative frequency histogram shows...Ch. 2 - Televisions (Example 1) The histogram shows the...Ch. 2 - Exercise Hours The histogram shows the...Ch. 2 - Shoes The graph is a dotplot of the number of...Ch. 2 - Condo Rental The dotplot shows rental prices per...Ch. 2 - Speeding Tickets (Example 2) A teacher asks 90...Ch. 2 - Breakfast Predict the shape of the distribution of...
Ch. 2 - Arm spans (Example 3) According to the ancient...Ch. 2 - Tuition The distribution of in-state annual...Ch. 2 - Ages of CEOs (Example 4) From the histogram in...Ch. 2 - Sleep Hours From the histogram shown in Exercise...Ch. 2 - Commute Times (Example 5) Use the histograms to...Ch. 2 - Spending on Clothes The histograms show the...Ch. 2 - Education (Example 6) In 2012, the General Social...Ch. 2 - Siblings The histogram shows the distribution of...Ch. 2 - Years of Education The GSS asked people how many...Ch. 2 - Hours Worked In the 2012 General Social Survey,...Ch. 2 - Matching Histograms match each of the following...Ch. 2 - Matching Histograms Match each of the following...Ch. 2 - Matching Match each description with the correct...Ch. 2 - Matching Match each description with the correct...Ch. 2 - Eating Out and jobs College students Jacqueline...Ch. 2 - Comparing Weights of Baseball and Soccer Players...Ch. 2 - Textbook Prices The table shows prices of 50...Ch. 2 - SAT scores The following table shows a random...Ch. 2 - Animal Longevity The following table in Exercise...Ch. 2 - Animal Gestation Periods The accompanying table...Ch. 2 - Tax Rate A StatCrunch survey asked people what...Ch. 2 - Pets A StatCrunch survey asked people whether they...Ch. 2 - Law School Tuition Data are shown for the cost of...Ch. 2 - Text Messages Recently, 115 users of StatCrunch...Ch. 2 - Beer, Calories Data are available on the number of...Ch. 2 - Beer, Alcohol Data are available on the percent...Ch. 2 - Changing Multiple-Choice Answers When Told Not to...Ch. 2 - Preventable Deaths According to the World Health...Ch. 2 - U.S. Distribution of wealth (Example 8) Michael...Ch. 2 - Education The graph shows the education of...Ch. 2 - Political Party Affiliation: Men The 2012 General...Ch. 2 - Political Party Affiliation Women The 2012 General...Ch. 2 - Prob. 43SECh. 2 - Retail Car Sales With gas prices rising, as they...Ch. 2 - Majors The table gives information on college...Ch. 2 - Adoptions The table gives information on the top...Ch. 2 - Garage The accompanying graph shows the...Ch. 2 - Body Image A student has gathered data on...Ch. 2 - Pie Chart of Sleep Hours The pie chart reports the...Ch. 2 - Age and Gender The following graph shows the ages...Ch. 2 - Musicians Survey: StatCrunch Graph The...Ch. 2 - Cell Phone Use Refer to the accompanying bar...Ch. 2 - Television The table shows the first few entries...Ch. 2 - Job The table shows the job categories for some...Ch. 2 - Hormone Replacement Therapy The use of the drug...Ch. 2 - E-Music The bar graph shows information reported...Ch. 2 - Hormone Replacement Therapy Again The following...Ch. 2 - Holding Your Breath A group of students held their...Ch. 2 - Global Temperatures The histograms show the...Ch. 2 - Employment after Law School Accredited law schools...Ch. 2 - Position for Breathing The graph shows the results...Ch. 2 - Opinions on Global Warming People were asked...Ch. 2 - Create a dotplot that has at least 10 observations...Ch. 2 - Create a dotplot that has at least 10 observations...Ch. 2 - Traffic Cameras College students Jeannette Mujica,...Ch. 2 - Ideal Weight Thirty-nine students (26 women and 13...Ch. 2 - MPH The graphs show the distribution of...Ch. 2 - Shoe Sizes The graph shows shoe sizes for men and...Ch. 2 - CEO Salaries Predict the shape of the distribution...Ch. 2 - Cigarettes A physician asks all of his patients to...Ch. 2 - Changing Multiple-Choice Answers When Told to Do...Ch. 2 - ER Visits for Injuries The graph shows the rates...
Additional Math Textbook Solutions
Find more solutions based on key concepts
the type of variable is the response.
Stats: Modeling the World Nasta Edition Grades 9-12
Provide an example of a qualitative variable and an example of a quantitative variable.
Elementary Statistics (Text Only)
In Exercises 9-20, use the data in the following table, which lists drive-thru order accuracy at popular fast f...
Essentials of Statistics (6th Edition)
Explain the procedure for obtaining the percentage of all the possible observations that lie within the specifi...
Introductory Statistics (10th Edition)
Knowledge Booster


Learn more about
Need a deep-dive on the concept behind this application? Look no further. Learn more about this topic, statistics and related others by exploring similar questions and additional content below.Recommended textbooks for you
 Glencoe Algebra 1, Student Edition, 9780079039897...AlgebraISBN:9780079039897Author:CarterPublisher:McGraw Hill
 Big Ideas Math A Bridge To Success Algebra 1: Stu...AlgebraISBN:9781680331141Author:HOUGHTON MIFFLIN HARCOURTPublisher:Houghton Mifflin Harcourt
 Holt Mcdougal Larson Pre-algebra: Student Edition...AlgebraISBN:9780547587776Author:HOLT MCDOUGALPublisher:HOLT MCDOUGAL
Glencoe Algebra 1, Student Edition, 9780079039897...
Algebra
ISBN:9780079039897
Author:Carter
Publisher:McGraw Hill
Big Ideas Math A Bridge To Success Algebra 1: Stu...
Algebra
ISBN:9781680331141
Author:HOUGHTON MIFFLIN HARCOURT
Publisher:Houghton Mifflin Harcourt
Holt Mcdougal Larson Pre-algebra: Student Edition...
Algebra
ISBN:9780547587776
Author:HOLT MCDOUGAL
Publisher:HOLT MCDOUGAL
The Shape of Data: Distributions: Crash Course Statistics #7; Author: CrashCourse;https://www.youtube.com/watch?v=bPFNxD3Yg6U;License: Standard YouTube License, CC-BY
Shape, Center, and Spread - Module 20.2 (Part 1); Author: Mrmathblog;https://www.youtube.com/watch?v=COaid7O_Gag;License: Standard YouTube License, CC-BY
Shape, Center and Spread; Author: Emily Murdock;https://www.youtube.com/watch?v=_YyW0DSCzpM;License: Standard Youtube License