
Videos
A study was conducted to demonstrate that soy beans inoculated with nitrogen-fixing bacteria yield more and grow adequately without expensive environmentally deleterious synthesized fertilizers. The trial was conducted under controlled conditions with uniform amounts of soil. The initial hypothesis was that inoculated plants would outperform their uninoculated counterparts. This assumption is based on the facts that plants need nitrogen to manufacture vital proteins and amino acids and that nitrogen-fixing bacteria would make more of this substance available to plants, increasing their size and yield. There were 8 inoculated plants (I) and 8 uninoculated plants (U). The plant yield as measured by pod weight for each plant is given in Table 2.20.
Table 2.20 Pod weight (g) from inoculated (I) and uninoculated (U) plants
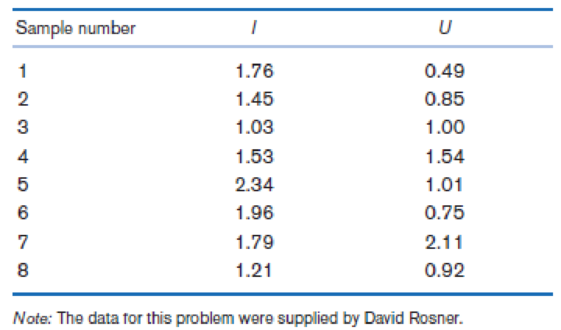
Use graphic methods to compare the two groups.

Trending nowThis is a popular solution!

Chapter 2 Solutions
Fundamentals of Biostatistics


- A study was conducted to assess the impact of nutrient enrichment on zooplankton densities in A & B Islands. An ecologist sampled populations of zooplankton in these two locations and observed the nutrient enrichment level was higher in A island when compared with the level in B island. It is predicted the zooplankton densities in A island will be greater than those found in B island.arrow_forwardA deficiency of the trace element selenium in the diet can negatively impact growth, immunity, muscle and neuromuscular function, and fertility. The introduction of selenium supplements to dairy cows is justified when pastures have low selenium levels. Authors of a research paper supplied the following data on milk selenium concentration (mg/L) for a sample of cows given a selenium supplement (the treatment group) and a control sample given no supplement, both initially and after a 9-day period. Initial Measurement Treatment Control 11.4 9.1 9.6 8.7 10.1 9.7 8.5 10.8 10.2 10.9 10.6 10.6 11.9 10.1 9.9 12.3 10.7 8.8 10.2 10.4 10.3 10.9 11.4 10.4 9.3 11.6 10.6 10.9 10.9 8.3 After 9 Days Treatment Control 138.3 9.2 104 8.9 96.4 8.9 89 10.1 88 9.6 103.8 8.6 147.3 10.4 97.1 12.4 172.6 9.2 146.3 9.5 99 8.4 122.3 8.8 103 12.5 117.8 9.1 121.5 93 (a) Use the given data for the treatment group to determine if…arrow_forwardThe purification of industrial waste is often a destructive process with manybeneficial components removed from the waste as part of the cleansing process. As part of some trials to reuse industrial sludge as a mulch for planting, conservation of existing nitrogen levels in the sludge is being studied. Nitrogen is used in plants to synthesize amino acids, proteins, chlorophyll, nucleic acids, and enzymes. Initial testing showed 1 kg of sludge contained 254 mg of nitrogen and after the cleaning process there were 189 mg of nitrogen left. What is the percentage reduction of nitrogen?arrow_forward
- A deficiency of the trace element selenium in the diet can negatively impact growth, immunity, muscle and neuromuscular function, and fertility. The introduction of selenium supplements to dairy cows is justified when pastures have low selenium levels. Authors of a research paper supplied the following data on milk selenium concentration (mg/L) for a sample of cows given a selenium supplement (the treatment group) and a control sample given no supplement, both initially and after a 9-day period. Initial Measurement Treatment Control 11.2 9.1 9.6 8.7 10.1 9.7 8.5 10.8 10.3 10.9 10.6 10.6 11.7 10.1 9.7 12.3 10.8 8.8 10.3 10.4 10.4 10.9 11.2 10.4 9.4 11.6 10.6 10.9 10.7 8.4 After 9 Days Treatment Control 138.3 9.3 104 8.7 96.4 8.7 89 10.1 88 9.6 103.8 8.6 147.3 10.2 97.1 12.2 172.6 9.3 146.3 9.5 99 8.2 122.3 8.9 103 12.5 117.8 9.1 121.5 93 (a) Use the given data for the treatment group to determine if there…arrow_forwardA deficiency of the trace element selenium in the diet can negatively impact growth, immunity, muscle and neuromuscular function, and fertility. The introduction of selenium supplements to dairy cows is justified when pastures have low selenium levels. Authors of a research paper supplied the following data on milk selenium concentration (mg/L) for a sample of cows given a selenium supplement (the treatment group) and a control sample given no supplement, both initially and after a 9-day period. Initial Measurement Treatment Control 11.3 9.1 9.7 8.7 10.1 9.7 8.5 10.8 10.4 10.9 10.7 10.6 11.8 10.1 9.8 12.3 10.6 8.8 10.4 10.4 10.2 10.9 11.3 10.4 9.2 11.6 10.7 10.9 10.8 8.2 After 9 Days Treatment Control 138.3 9.4 104 8.8 96.4 8.8 89 10.1 88 9.7 103.8 8.7 147.3 10.3 97.1 12.3 172.6 9.4 146.3 9.5 99 8.3 122.3 8.9 103 12.5 117.8 9.1 121.5 93 (a) Use the given data for the treatment group to determine if…arrow_forwardDDT (dichlorodiphenyltrichloroethane) was used extensively from 1940 to 1970 as an insecticide. It still sees limited use for control of disease. But DDT was found to be harmful to plants and animals, including humans, and its effects were found to be lasting. The amount of time that DDT remains in the environment depends on many factors, but the following table shows what can be expected of 200 kilograms of DDT that has seeped into the soil. t = time in yearssince application D = DDT remaining,kilograms 0 200.00 1 190.00 2 180.50 3 171.48 (a) Show that the data are exponential. The ratio from year 0 to year 1 is ______ , from year 1 to year 2 is ____ , and from year 2 to year 3 is_____ (rounded to two decimal places). Because these successive ratios are all , a) different b)the same , the data are exponential.arrow_forward
- Patients immobilized for a substantial amount of time can develop deep vein thrombosis (DVT), a blood clot in a leg or pelvis vein. DVT can have serious adverse health effects and can be difficult to diagnose. On its website, drug manufacturer Pfizer reports the outcome of a study looking at the effectiveness of the drug Fragmin (dalteparin) in preventing DVT in immobilized patients. Of the 1518 randomly chosen immobilized patients given Fragmin, 42 experienced a complication from DVT. Of the 1473 randomly chosen immobilized patients given a placebo, 73 experienced a complication from DVT. Compute the proportion (risk) of patients experiencing DVT complications for immobilized patients treated with Fragmin. (Enter the proportion with 4 decimal places. DO NOT enter the percent.)arrow_forwardOne effect of the pesticide DDT upon birds is to inhibit the production of the enzyme carbonic anhydrase, which controls calcium metabolism. It is believed that this causes eggshells to be thinner and weaker than normal and makes the eggs more prone to breakage. An experiment was conducted where 16 sparrow hawks were fed a mixture of 3 ppm dieldrin and 15 ppm DDT (a combination often found in contaminated prey). The first egg laid by each bird was measured, and the mean shell thickness was found to be 0.19 mm. A “normal” eggshell has a mean thickness of 0.2 mm. What are the null and alternative hypotheses?arrow_forwardThere have been many studies recently concerning coffee drinking and cholesterol level. While it is known that several coffee-bean components can elevate blood cholesterol level, it is thought that a new type of paper coffee filter may reduce the presence of some of these components in coffee. The effect of the new filter on cholesterol level will be studied over a 10-week period using 300 nonsmokers who each drink 4 cups of caffeinated coffee per day. Each of these 300 participants will be assigned to one of two groups: the experimental group, who will only drink coffee that has been made with the new filter, or the control group, who will only drink coffee that has been made with the standard filter. Each participant’s cholesterol level will be measured at the beginning and at the end of the study. Describe an appropriate method for assigning the subjects to the two groups so that each group will have an equal number of subjects. In this study, the researchers chose to include a…arrow_forward
- There have been many studies recently concerning coffee drinking and cholesterol level. While it is known that several coffee-bean components can elevate blood cholesterol level, it is thought that a new type of paper coffee filter may reduce the presence of some of these components in coffee. The effect of the new filter on cholesterol level will be studied over a 10-week period using 300 nonsmokers who each drink 4 cups of caffeinated coffee per day. Each of these 300 participants will be assigned to one of two groups: the experimental group, who will only drink coffee that has been made with the new filter, or the control group, who will only drink coffee that has been made with the standard filter. Each participant’s cholesterol level will be measured at the beginning and at the end of the study. Which test would you conduct to determine whether the change in cholesterol level would be greater if people used the new filter rather than using the standard filter? Why would the…arrow_forwardResearchers are interested in testing the effectiveness of a new immunosuppressive therapy to be used post-transplant to reduce graft failure in the host. Suppose researchers investigating this new therapy are concerned about the dangerous side-effects of the drug. For instance, participants that would like to enroll in the study are not allowed to already have diabetes, as the immunosuppressive agent has been found to drastically increase fasting glucose levels, which could be very dangerous for diabetics. This means, however, that participants that enter and are treated with the new drug may develop diabetes as time goes on. Suppose the following table addresses the incidence of diabetes in the study depending on treatment group. (α=.05) Type II Diabetes No Type II Diabetes Total Investigational Drug 45 19 64 Best standard of Care 70 123 193 Total 115 142 257 Ho? Ha? x2 value? X2 critical? p value? conclusion?arrow_forwardDue to the increasing number of customers, MTAKUJA commercial Bank located at the University of Dar es Salaam has been facing the problem of long customers' queues since the beginning of this year. The Branch manager decided to conduct a small study to determine the cause of this problem. The study concluded that most of its bank tellers were slow and less efficient. However, the study recommended that the long queues would decrease substantially if at least two of its three banks tellers are operating efficiently. Therefore, to solve this problem the bank came up with the new policy that each bank taller should process at least 25 customers per hour. The probability that the first, second and third bank tellers will fail to comply with the new policy is 0.12, 0.09 and 0.1 respectively. Assume that the three counters at MTAKUJA bank operate independent of each other, find the probability that the queues will decrease substantially.arrow_forward
 MATLAB: An Introduction with ApplicationsStatisticsISBN:9781119256830Author:Amos GilatPublisher:John Wiley & Sons Inc
 Probability and Statistics for Engineering and th...StatisticsISBN:9781305251809Author:Jay L. DevorePublisher:Cengage Learning
 Statistics for The Behavioral Sciences (MindTap C...StatisticsISBN:9781305504912Author:Frederick J Gravetter, Larry B. WallnauPublisher:Cengage Learning
 Elementary Statistics: Picturing the World (7th E...StatisticsISBN:9780134683416Author:Ron Larson, Betsy FarberPublisher:PEARSON
 The Basic Practice of StatisticsStatisticsISBN:9781319042578Author:David S. Moore, William I. Notz, Michael A. FlignerPublisher:W. H. Freeman
 Introduction to the Practice of StatisticsStatisticsISBN:9781319013387Author:David S. Moore, George P. McCabe, Bruce A. CraigPublisher:W. H. Freeman