
Concept explainers
Videos
The data in Table 2.15 are a sample of cholesterol level: taken from 24 hospital employees who were on a standard American diet and who agreed to adopt a vegetarian die for 1 month. Semm-cholesterol measurements were mad< before adopting the diet and 1 month after. The data art j. available at cholesterol-xls at www.cengagebrain.com.
TABLE 2.15 Serum-cholesterol levels (mg/dL) before and after adopting a vegetarian diet
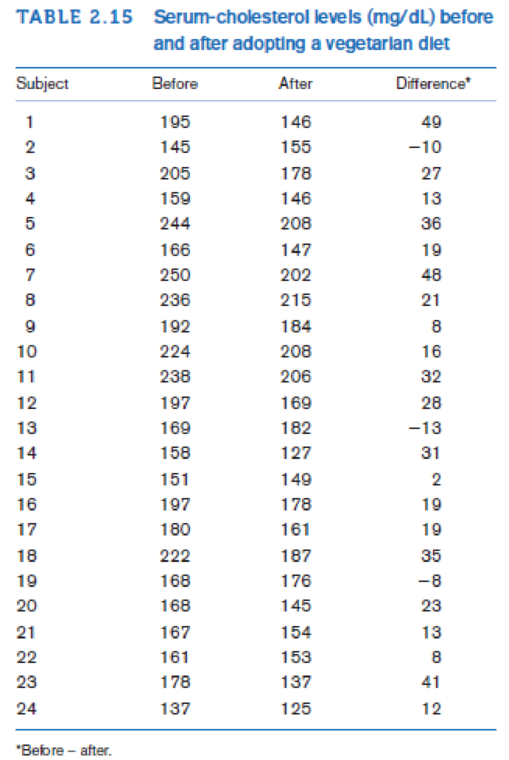
Some investigators believe that the effects of diet on cholesterol are more evident in people with high rather than low cholesterol levels. If you split the data in Table 2.15 according to whether baseline cholesterol is above or below the median, can you comment descriptively on this issue?

Trending nowThis is a popular solution!

Chapter 2 Solutions
Fundamentals of Biostatistics


 Glencoe Algebra 1, Student Edition, 9780079039897...AlgebraISBN:9780079039897Author:CarterPublisher:McGraw Hill
 Big Ideas Math A Bridge To Success Algebra 1: Stu...AlgebraISBN:9781680331141Author:HOUGHTON MIFFLIN HARCOURTPublisher:Houghton Mifflin Harcourt
 College Algebra (MindTap Course List)AlgebraISBN:9781305652231Author:R. David Gustafson, Jeff HughesPublisher:Cengage Learning
 Holt Mcdougal Larson Pre-algebra: Student Edition...AlgebraISBN:9780547587776Author:HOLT MCDOUGALPublisher:HOLT MCDOUGAL