Concept explainers
Videos
(a)
To sketch:The graph of the functions.
(a)
Explanation of Solution
Given information:
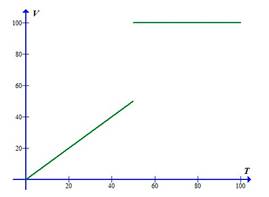
Consider the equation with increasing temperature,
Calculation:
The graph of the voltage with increasing temperature
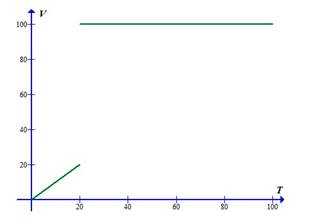
The graph of the voltage with decreasing temperature
(b)
To find:The left and right hand limits of
(b)
Answer to Problem 33SP
The left hand limits are
The right hand limits are
Explanation of Solution
Given information:
Consider the equation with increasing temperature,
Calculation:
The left hand limit of increasing temperature
The right hand limit of decreasing temperature
Hence, the left hand limits are
(c)
To find:The left and right hand limits of
(c)
Answer to Problem 33SP
The left hand limits are
The right hand limits are
Explanation of Solution
Given information:
Consider the equation with increasing temperature,
Calculation:
The left hand limit of increasing temperature
The right hand limit of decreasing temperature
The left hand limits are
The right hand limits are
Want to see more full solutions like this?
Chapter 2 Solutions
Modeling the Dynamics of Life: Calculus and Probability for Life Scientists


 Algebra & Trigonometry with Analytic GeometryAlgebraISBN:9781133382119Author:SwokowskiPublisher:Cengage
 Calculus For The Life SciencesCalculusISBN:9780321964038Author:GREENWELL, Raymond N., RITCHEY, Nathan P., Lial, Margaret L.Publisher:Pearson Addison Wesley,
 College Algebra (MindTap Course List)AlgebraISBN:9781305652231Author:R. David Gustafson, Jeff HughesPublisher:Cengage Learning