Business Statistics: A First Course (7th Edition)
7th Edition
ISBN: 9780321979018
Author: David M. Levine, Kathryn A. Szabat, David F. Stephan
Publisher: PEARSON
expand_more
expand_more
format_list_bulleted
Concept explainers
Videos
Textbook Question
Chapter 2, Problem 2.24AC
An online survey of CFA Institute members was conducted to gather feedback on market sentiment, performance, and market
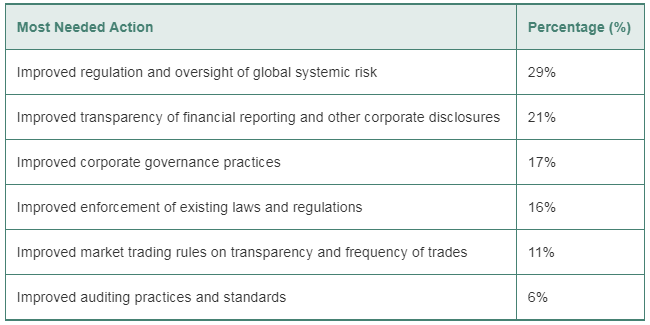
- Construct a bar chart, a pie chart, and a Pareto chart.
- Which graphical method do you think is best for portraying these data?
- What conclusions can you reach concerning the most needed action to improve investor trust and market integrity?
Expert Solution & Answer
Want to see the full answer?
Check out a sample textbook solution
Students have asked these similar questions
You may need to use the appropriate technology to answer this question.
The American Association of Individual Investors (AAII) On-Line Discount Broker Survey polls members on their experiences with discount brokers. As part of the survey, members were asked to rate the quality of the speed of execution with their broker as well as provide an overall satisfaction rating for
electronic trades. Possible responses (scores) were no opinion (0), unsatisfied (1), somewhat satisfied (2), satisfied (3), and very satisfied (4). For each broker summary scores were computed by calculating a weighted average of the scores provided by each respondent. Suppose a portion of the survey results
follow.
Brokerage Speed Satisfaction
O
Ho: B₁ * 0
Ha: B₁:
= 0
Ho: B₁ ≥ 0
Ha: B₁ <0
Ho: B₁:
Ha: B₁ * 0
= 0
|Ọ Ho: Bo #0
Ha: Bo
= 0
A
Ho: Po = 0
Ha: Bo # 0
B
с
D
E
F
G
H
I
J
K
3.4
3.3
3.4
3.6
3.2
3.8
3.8
2.6
2.7
4.0
2.5
3.5
3.6
3.9
These ratings data on x = the quality of the speed of execution and y = overall…
Below are the results of a survey of America's best graduate and professional schools. The top 25 business schools, as determined by reputation, student selectivity, placement success, and graduation rate, are listed in the table. For each school, three variables were measured: (1) GMAT score for the typical incoming student; (2) student acceptance rate (percentage accepted of all students who applied); and (3) starting salary of the typical graduating student.
School GMAT Acc. Rate Salary
Harvard 644 15.0% $ 63,000
Stanford 665 10.2 60,000
Penn 644 19.4 55,000
Northwestern 640 22.6 54,000
MIT 650 21.3 57,000
Chicago 632 30.0 55,269
Duke 630 18.2 53,300
Dartmouth 649 13.4 52,000
Virginia 630 23.0 55,269
Michigan 620 32.4 53.300
Columbia 635 37.1…
The American Association of Individual Investors (AAII) On-Line Discount Broker Survey polls members on their experiences with discount brokers. As part of the survey, members were asked to rate the quality of the speed of execution with their broker as well as provide an overall
satisfaction rating for electronic trades. Possible responses (scores) were no opinion (0), unsatisfled (1), somewhat satisfied (2), satisfied (3), and very satisfled (4). For each broker summary scores were computed by calculating a weighted average of the scores provided by each
respondent. A portion of the survey results follow.t
Brokerage
Speed
Satisfaction
Scottrade, Inc.
3.4
3.5
Charles Schwab
3.3
3.4
Fidelity Brokerage Services
3.4
3.9
TD Ameritrade
3.6
3.7
E*Trade Financial
3.2
2.9
Vanguard Brokerage Services
3.8
2.8
USAA Brokerage Services
3.8
3.6
Thinkorswim
2.6
2.6
Wells Fargo Investments
2.7
2.3
Interactive Brokers
4.0
4.0
Zecco.com
2.5
2.5
(a) Develop a scatter diagram for these data with the…
Chapter 2 Solutions
Business Statistics: A First Course (7th Edition)
Ch. 2 - Prob. 2.1LBCh. 2 - The following data represent the responses to two...Ch. 2 - Prob. 2.3ACCh. 2 - Prob. 2.4ACCh. 2 - Prob. 2.5ACCh. 2 - Prob. 2.6ACCh. 2 - Prob. 2.7ACCh. 2 - A survey of 1,085 adults asked Do you enjoy...Ch. 2 - Prob. 2.9ACCh. 2 - Prob. 2.10AC
Ch. 2 - Prob. 2.11LBCh. 2 - Prob. 2.12LBCh. 2 - Prob. 2.13LBCh. 2 - Prob. 2.14LBCh. 2 - The file NBACost2013 contains the total cost ($)...Ch. 2 - The file UTILITY contains the following data about...Ch. 2 - Prob. 2.17ACCh. 2 - One operation of a mill to cut pieces of steel...Ch. 2 - A manufacturing company produces steel housings...Ch. 2 - Prob. 2.21ACCh. 2 - Prob. 2.22ACCh. 2 - Prob. 2.23ACCh. 2 - An online survey of CFA Institute members was...Ch. 2 - Prob. 2.25ACCh. 2 - Prob. 2.26ACCh. 2 - Prob. 2.27ACCh. 2 - The following table indicates the percentage of...Ch. 2 - Prob. 2.29ACCh. 2 - Prob. 2.30ACCh. 2 - A study of Kickstarter projects showed that 54.2%...Ch. 2 - Prob. 2.32ACCh. 2 - Prob. 2.33LBCh. 2 - Prob. 2.34LBCh. 2 - Prob. 2.35ACCh. 2 - Prob. 2.37ACCh. 2 - The file UTILITY contains the following data about...Ch. 2 - Prob. 2.39ACCh. 2 - Prob. 2.40ACCh. 2 - Prob. 2.41ACCh. 2 - Prob. 2.42ACCh. 2 - Prob. 2.43ACCh. 2 - Prob. 2.45ACCh. 2 - Prob. 2.46ACCh. 2 - The data stored in DRINK represents the amount of...Ch. 2 - Prob. 2.48LBCh. 2 - Prob. 2.49LBCh. 2 - Prob. 2.50ACCh. 2 - Data were collected on the typical cost of dining...Ch. 2 - College football is big business, with coaches pay...Ch. 2 - Prob. 2.54ACCh. 2 - Prob. 2.56ACCh. 2 - Prob. 2.57ACCh. 2 - Prob. 2.58ACCh. 2 - Prob. 2.59ACCh. 2 - Prob. 2.60ACCh. 2 - Prob. 2.61ACCh. 2 - Prob. 2.66ACCh. 2 - Prob. 2.67ACCh. 2 - Prob. 2.68ACCh. 2 - Prob. 2.69ACCh. 2 - Prob. 2.71ACCh. 2 - (Student Project) The Data and Story Library...Ch. 2 - Prob. 2.73ACCh. 2 - Prob. 2.75ACCh. 2 - Figure 2.1 shows a bar chart and a pie chart for...Ch. 2 - Prob. 2.78ACCh. 2 - Prob. 2.79CYUCh. 2 - Prob. 2.80CYUCh. 2 - Prob. 2.81CYUCh. 2 - Compare and contrast the bar chart for categorical...Ch. 2 - Prob. 2.83CYUCh. 2 - Prob. 2.84CYUCh. 2 - What are the three different ways to break down...Ch. 2 - How can a multidimensional table differ from a...Ch. 2 - Prob. 2.87CYUCh. 2 - Prob. 2.88CRPCh. 2 - The owner of a restaurant that serves...Ch. 2 - Suppose that the owner of the restaurant in...Ch. 2 - Prob. 2.94CRPCh. 2 - One of the major measures of the quality of...Ch. 2 - Prob. 2.98CRPCh. 2 - The file CEO-Compensation includes the total...Ch. 2 - Prob. 2.100CRPCh. 2 - What was the average price of a room at two-star,...Ch. 2 - Prob. 2.102CRPCh. 2 - Prob. 2.103CRPCh. 2 - The following data (stored in Drink) represent...Ch. 2 - Prob. 2.106CRPCh. 2 - Prob. 2.109RWE
Knowledge Booster


Learn more about
Need a deep-dive on the concept behind this application? Look no further. Learn more about this topic, statistics and related others by exploring similar questions and additional content below.Similar questions
- The American Association of Individual Investors (AAII) On-Line Discount Broker Survey polls members on their experiences with electronic trades handled by discount brokers. As part of the survey, members were asked to rate their satisfaction with the trade price and the speed of execution, as well as provide an overall satisfaction rating. Possible responses (scores) were no opinion (0), unsatisfied (1), somewhat satisfied (2), satisfied (3), and very satisfied (4). For each broker, summary scores were computed by computing a weighted average of the scores provided by each respondent. A portion the survey results follow (AAII web site, February 7, 2012). Click on the datafile logo to reference the data. 4.0 1.0 2.0 (a) Develop an estimated regression equation using trade price and speed of execution to predict overall satisfaction…arrow_forwardThe American Association of Individual Investors (AAII) On-Line Discount Broker Survey polls members on their experiences with electronic trades handled by discount brokers. As part of the survey, members were asked to rate their satisfaction with the trade price and the speed of execution, as well as provide an overall satisfaction rating. Possible responses (scores) were no opinion (0), unsatisfied (1), somewhat satisfied (2), satisfied (3), and very satisfied (4). For each broker, summary scores were computed by computing a weighted average of the scores provided by each respondent. A portion the survey results follow (AAII website, February 7, 2012). Brokerage Scottrade, Inc. Charles Schwab Fidelity Brokerage Services TD Ameritrade E*Trade Financial (Not listed) Vanguard Brokerage Services USAA Brokerage Services Thinkorswim Wells Fargo Investments Interactive Brokers Zecco.com Firstrade Securities Banc of America Investment Services Satisfaction with Satisfaction with Overall…arrow_forwardThe American Association of Individual Investors (AAII) On-Line Discount Broker Survey polls members on their experiences with electronic trades handled by discount brokers. As part of the survey, members were asked to rate their satisfaction with the trade price and the speed of execution, as well as provide an overall satisfaction rating. Possible responses (scores) were no opinion (0), unsatisfied (1), somewhat satisfied (2), satisfied (3), and very satisfied (4). For each broker, summary scores were computed by computing a weighted average of the scores provided by each respondent. A portion the survey results follow (AAII website, February 7, 2012). Satisfaction with Satisfaction with Overall Satisfaction with Brokerage Trade Price Speed of Execution Electronic Trades Scottrade, Inc. 3.4 3.4 3.5 Charles Schwab 3.2 3.3 3.4 Fidelity Brokerage Services 3.1 3.4 3.9 TD Ameritrade 2.9 3.6 3.7 E*Trade Financial 2.9 3.2 2.9 (Not listed) 2.5 3.2 2.7 Vanguard Brokerage Services 2.6 3.8 2.8…arrow_forward
- The American Association of Individual Investors (AAII) On-Line Discount Broker Survey polls members on their experiences with electronic trades handled by discount brokers. As part of the survey, members were asked to rate their satisfaction with the trade price and the speed of execution, as well as provide an overall satisfaction rating. Possible responses (scores) were no opinion (0), unsatisfied (1), somewhat satisfied (2), satisfied (3), and very satisfied (4). For each broker, summary scores were computed by computing a weighted average of the scores provided by each respondent. A portion the survey results follow (AAII web site, February 7, 2012). Click on the datafile logo to reference the data. Brokerage Satisfaction withTrade Price Satisfaction withSpeed of Execution Overall Satisfaction withElectronic Trades Scottrade, Inc. 3.4 3.4 3.5 Charles Schwab 3.2 3.3 3.4 Fidelity Brokerage Services 3.1 3.4 3.9 TD Ameritrade 2.9 3.6 3.7 E*Trade Financial 2.9 3.2…arrow_forwardThe American Association of Individual Investors (AAII) On-Line Discount Broker Survey polls members on their experiences with electronic trades handled by discount brokers. As part of the survey, members were asked to rate their satisfaction with the trade price and the speed of execution, as well as provide an overall satisfaction rating. Possible responses (scores) were no opinion (0), unsatisfied (1), somewhat satisfied (2), satisfied (3), and very satisfied (4). For each broker, summary scores were computed by computing a weighted average of the scores provided by each respondent. A portion the survey results follow (AAII website, February 7, 2012). (a) Develop an estimated regression equation using trade price and speed of execution to predict overall satisfaction with the broker. Let x1 represent satisfaction with Trade Price. Let x2 represent satisfaction with speed of execution. If required, round your answers to four decimal places. For subtractive or…arrow_forwardThe American Association of Individual Investors (AAII) On-Line Discount Broker Survey polls members on their experiences with electronic trades handled by discount brokers. As part of the survey, members were asked to rate their satisfaction with the trade price and the speed of execution, as well as provide an overall satisfaction rating. Possible responses (scores) were no opinion (0),unsatisfied (1), somewhat satisfied (2),satisfied (3),and very satisfied (4).For each broker, summary scores were computed by computing a weighted average of the scores provided by each respondent. A portion of the survey results follows (AAII website, February 7,20 12). a. Develop an estimated regression equation using trade price and speed of execution to predict overall satisfaction with the broker. b.Finger Lakes Investments has developed a new electronic trading system and would like to predict overall customer satisfaction assuming they can provide satisfactory levels of service levels (3}for…arrow_forward
- The American Association of Individual Investors (AAII) On-Line Discount Broker Survey polls members on their experiences with electronic trades handled by discount brokers. As part of the survey, members were asked to rate their satisfaction with the trade price and the speed of execution, as well as provide an overall satisfaction rating. Possible responses (scores) were no opinion (0), unsatisfied (1), somewhat satisfied (2), satisfied (3), and very satisfied (4). For each broker, summary scores were computed by computing a weighted average of the scores provided by each respondent. A portion the survey results follow (AAII website, February 7, 2012). Satisfaction with Satisfaction with Overall Satisfaction with Brokerage Trade Price Speed of Execution Electronic Trades Scottrade, Inc. Charles Schwab 3.3 3.1 3.4 3.2 3.3 3.3 Fidelity Brokerage Services 3.1 3.3 4.0 TD Ameritrade 2.9 3.5 3.7 E*Trade Financial 2.8 3.2 2.9 (Not listed) 2.4 3.2 2.7 Vanguard Brokerage Services 2.6 3.8 2.8…arrow_forwardThe American Association of Individual Investors (AAII) On-Line Discount Broker Survey polls members on their experiences with electronic trades handled by discount brokers. As part of the survey, members were asked to rate their satisfaction with the trade price and the speed of execution, as well as provide an overall satisfaction rating. Possible responses (scores) were no opinion (0), unsatisfied (1), somewhat satisfied (2), satisfied (3), and very satisfied (4). For each broker, summary scores were computed by computing a weighted average of the scores provided by each respondent. A portion of the survey results follow (AAII web site). (Let x, represent satisfaction with trade price, x, represent satisfaction with speed of execution, and y represent overall satisfaction with electronic trades.) Satisfaction with Trade Price Satisfaction with Brokerage Overall Satisfaction with Electronic Trades Speed of Execution Scottrade, Inc. 3.4 3.4 3.5 Charles Schwab 3.2 3.3 3.4 Fidelity…arrow_forwardIn determining the best companies to work for, a number of variables are considered, including size, average annual pay, and turnover rate. Moreover, employee surveys are conducted to assess aspects of the organization's culture, such as trust and openness to change. In an attempt to determine what affects turnover rate, a sample of 33 companies was randomly selected, and data were collected on the average annual bonus and turnover rate (%) for 2008. In addition, a questionnaire was administered to the employees of each company to arrive at a trust index (measured on a scale of 0-100). Below are the multiple regression results. Dependent Variable is Turnover Rate Predictor Coef SE Coef Constant 12.1005 0.7826 15.46 0.000 Trust Index -0.07149 0.01966 -3.64 0.001 Average Bonus -0.0007216 0.0001481 -4.87 0.000 S= 1.49746 R-Sq = 79.6% R-Sq (adj) = 78.3%arrow_forward
- The American Association of Individual Investors (AAII) On-Line Discount Broker Survey polls members on their experiences with electronic trades handled by discount brokers. As part of the survey, members were asked to rate their satisfaction with the trade price and the speed of execution, as well as provide an overall satisfaction rating. Possible responses (scores) were no opinion (0), unsatisfied (1), somewhat satisfied (2), satisfied (3), and very satisfied (4). For each broker, summary scores were computed by computing a weighted average of the scores provided by each respondent. A portion the survey results follow (AAII web site, February 7, 2012). Brokerage Satisfaction withTrade Price Satisfaction withSpeed of Execution Overall Satisfaction withElectronic Trades Scottrade, Inc. 3.4 3.4 3.5 Charles Schwab 3.2 3.3 3.4 Fidelity Brokerage Services 3.1 3.4 3.9 TD Ameritrade 2.9 3.6 3.7 E*Trade Financial 2.9 3.2 2.9 (Not listed) 2.5 3.2 2.7 Vanguard Brokerage…arrow_forwardThe American Association of Individual Investors (AAII) On-Line Discount Broker Survey polls members on their experiences with electronic trades handled by discount brokers. As part of the survey, members were asked to rate their satisfaction with the trade price and the speed of execution, as well as provide an overall satisfaction rating. Possible responses (scores) were no opinion (0), unsatisfied (1), somewhat satisfied (2), satisfied (3), and very satisfied (4). For each broker, summary scores were computed by computing a weighted average of the scores provided by each respondent. A portion the survey results follow (AAII website, February 7, 2012). Brokerage Satisfaction withTrade Price Satisfaction withSpeed of Execution Overall Satisfaction withElectronic Trades Scottrade, Inc. 3.3 3.1 3.4 Charles Schwab 3.2 3.3 3.3 Fidelity Brokerage Services 3.1 3.3 4.0 TD Ameritrade 2.9 3.5 3.7 E*Trade Financial 2.8 3.2 2.9 (Not listed) 2.4 3.2 2.7 Vanguard Brokerage…arrow_forwardThe American Association of Individual Investors (AAII) On-Line Discount Broker Survey polls members on their experiences with discount brokers. As part of the survey, members were asked to rate the quality of the speed of execution with their broker as well as provide an overall satisfaction rating for electronic trades. Possible responses (scores) were no opinion (0), unsatisfied (1), somewhat satisfied (2), satisfied (3), and very satisfied (4). For each broker summary scores were computed by calculating a weighted average of the scores provided by each respondent. A portion of the survey results follow.t Brokerage Speed Satisfaction Scottrade, Inc. 3.4 3.5 Charles Schwab 3.3 3.4 Fidelity Brokerage Services 3.4 3.9 TD Ameritrade 3.6 3.7 E*Trade Financial 3.2 2.9 Vanguard Brokerage Services 3.8 2.8 USAA Brokerage Services 3.8 3.6 Thinkorswim 2.6 2.6 Wells Fargo Investments 2.7 2.3 Interactive Brokers 4.0 4.0 Zecco.com 2.5 2.5 (a) Develop a scatter diagram for these data with the…arrow_forward
arrow_back_ios
SEE MORE QUESTIONS
arrow_forward_ios
Recommended textbooks for you
 Glencoe Algebra 1, Student Edition, 9780079039897...AlgebraISBN:9780079039897Author:CarterPublisher:McGraw Hill
 Big Ideas Math A Bridge To Success Algebra 1: Stu...AlgebraISBN:9781680331141Author:HOUGHTON MIFFLIN HARCOURTPublisher:Houghton Mifflin Harcourt
Glencoe Algebra 1, Student Edition, 9780079039897...
Algebra
ISBN:9780079039897
Author:Carter
Publisher:McGraw Hill
Big Ideas Math A Bridge To Success Algebra 1: Stu...
Algebra
ISBN:9781680331141
Author:HOUGHTON MIFFLIN HARCOURT
Publisher:Houghton Mifflin Harcourt
The Shape of Data: Distributions: Crash Course Statistics #7; Author: CrashCourse;https://www.youtube.com/watch?v=bPFNxD3Yg6U;License: Standard YouTube License, CC-BY
Shape, Center, and Spread - Module 20.2 (Part 1); Author: Mrmathblog;https://www.youtube.com/watch?v=COaid7O_Gag;License: Standard YouTube License, CC-BY
Shape, Center and Spread; Author: Emily Murdock;https://www.youtube.com/watch?v=_YyW0DSCzpM;License: Standard Youtube License