Business Statistics: A First Course (7th Edition)
7th Edition
ISBN: 9780321979018
Author: David M. Levine, Kathryn A. Szabat, David F. Stephan
Publisher: PEARSON
expand_more
expand_more
format_list_bulleted
Concept explainers
Videos
Textbook Question
Chapter 2, Problem 2.91CRP
The owner of a restaurant that serves Continental-style entrées has the business objective of learning more about the patterns of patron demand during the Friday-to-Sunday weekend time period. Data were collected from 630 customers on the type of entrée ordered and were organized in the following table (and stored in ENMTREE):
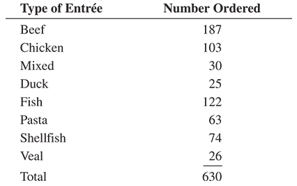
- Construct a percentage summary table for the types of entrées ordered.
- Construct a bar chart, a pie chart, doughnut chart, and a Pareto chart for the types of entrées ordered.
- Do you prefer using a Pareto Chart or a pie Chart for these data? Why?
- What conclusions can the restaurant owner reach concerning demand for different types of entrées?
Expert Solution & Answer
Want to see the full answer?
Check out a sample textbook solution
Chapter 2 Solutions
Business Statistics: A First Course (7th Edition)
Ch. 2 - Prob. 2.1LBCh. 2 - The following data represent the responses to two...Ch. 2 - Prob. 2.3ACCh. 2 - Prob. 2.4ACCh. 2 - Prob. 2.5ACCh. 2 - Prob. 2.6ACCh. 2 - Prob. 2.7ACCh. 2 - A survey of 1,085 adults asked Do you enjoy...Ch. 2 - Prob. 2.9ACCh. 2 - Prob. 2.10AC
Ch. 2 - Prob. 2.11LBCh. 2 - Prob. 2.12LBCh. 2 - Prob. 2.13LBCh. 2 - Prob. 2.14LBCh. 2 - The file NBACost2013 contains the total cost ($)...Ch. 2 - The file UTILITY contains the following data about...Ch. 2 - Prob. 2.17ACCh. 2 - One operation of a mill to cut pieces of steel...Ch. 2 - A manufacturing company produces steel housings...Ch. 2 - Prob. 2.21ACCh. 2 - Prob. 2.22ACCh. 2 - Prob. 2.23ACCh. 2 - An online survey of CFA Institute members was...Ch. 2 - Prob. 2.25ACCh. 2 - Prob. 2.26ACCh. 2 - Prob. 2.27ACCh. 2 - The following table indicates the percentage of...Ch. 2 - Prob. 2.29ACCh. 2 - Prob. 2.30ACCh. 2 - A study of Kickstarter projects showed that 54.2%...Ch. 2 - Prob. 2.32ACCh. 2 - Prob. 2.33LBCh. 2 - Prob. 2.34LBCh. 2 - Prob. 2.35ACCh. 2 - Prob. 2.37ACCh. 2 - The file UTILITY contains the following data about...Ch. 2 - Prob. 2.39ACCh. 2 - Prob. 2.40ACCh. 2 - Prob. 2.41ACCh. 2 - Prob. 2.42ACCh. 2 - Prob. 2.43ACCh. 2 - Prob. 2.45ACCh. 2 - Prob. 2.46ACCh. 2 - The data stored in DRINK represents the amount of...Ch. 2 - Prob. 2.48LBCh. 2 - Prob. 2.49LBCh. 2 - Prob. 2.50ACCh. 2 - Data were collected on the typical cost of dining...Ch. 2 - College football is big business, with coaches pay...Ch. 2 - Prob. 2.54ACCh. 2 - Prob. 2.56ACCh. 2 - Prob. 2.57ACCh. 2 - Prob. 2.58ACCh. 2 - Prob. 2.59ACCh. 2 - Prob. 2.60ACCh. 2 - Prob. 2.61ACCh. 2 - Prob. 2.66ACCh. 2 - Prob. 2.67ACCh. 2 - Prob. 2.68ACCh. 2 - Prob. 2.69ACCh. 2 - Prob. 2.71ACCh. 2 - (Student Project) The Data and Story Library...Ch. 2 - Prob. 2.73ACCh. 2 - Prob. 2.75ACCh. 2 - Figure 2.1 shows a bar chart and a pie chart for...Ch. 2 - Prob. 2.78ACCh. 2 - Prob. 2.79CYUCh. 2 - Prob. 2.80CYUCh. 2 - Prob. 2.81CYUCh. 2 - Compare and contrast the bar chart for categorical...Ch. 2 - Prob. 2.83CYUCh. 2 - Prob. 2.84CYUCh. 2 - What are the three different ways to break down...Ch. 2 - How can a multidimensional table differ from a...Ch. 2 - Prob. 2.87CYUCh. 2 - Prob. 2.88CRPCh. 2 - The owner of a restaurant that serves...Ch. 2 - Suppose that the owner of the restaurant in...Ch. 2 - Prob. 2.94CRPCh. 2 - One of the major measures of the quality of...Ch. 2 - Prob. 2.98CRPCh. 2 - The file CEO-Compensation includes the total...Ch. 2 - Prob. 2.100CRPCh. 2 - What was the average price of a room at two-star,...Ch. 2 - Prob. 2.102CRPCh. 2 - Prob. 2.103CRPCh. 2 - The following data (stored in Drink) represent...Ch. 2 - Prob. 2.106CRPCh. 2 - Prob. 2.109RWE
Additional Math Textbook Solutions
Find more solutions based on key concepts
To explain would this correlation increase, decrease or not change much if we remove the elephants.
Statistics Through Applications
the type of variable is the response.
Stats: Modeling the World Nasta Edition Grades 9-12
Testing Hypotheses. In Exercises 13-24, assume that a simple random sample has been selected and test the given...
Elementary Statistics Using the TI-83/84 Plus Calculator, Books a la Carte Edition (4th Edition)
A father rates his daughter as a 2 on a 7-point scale (from 1 to 7) of crankiness. In this example, (a) what is...
Statistics for Psychology
Why is it difficult to define quality?
Introduction to Statistical Quality Control
Knowledge Booster


Learn more about
Need a deep-dive on the concept behind this application? Look no further. Learn more about this topic, statistics and related others by exploring similar questions and additional content below.Recommended textbooks for you
 Glencoe Algebra 1, Student Edition, 9780079039897...AlgebraISBN:9780079039897Author:CarterPublisher:McGraw Hill
 Holt Mcdougal Larson Pre-algebra: Student Edition...AlgebraISBN:9780547587776Author:HOLT MCDOUGALPublisher:HOLT MCDOUGAL
 Big Ideas Math A Bridge To Success Algebra 1: Stu...AlgebraISBN:9781680331141Author:HOUGHTON MIFFLIN HARCOURTPublisher:Houghton Mifflin Harcourt
Glencoe Algebra 1, Student Edition, 9780079039897...
Algebra
ISBN:9780079039897
Author:Carter
Publisher:McGraw Hill
Holt Mcdougal Larson Pre-algebra: Student Edition...
Algebra
ISBN:9780547587776
Author:HOLT MCDOUGAL
Publisher:HOLT MCDOUGAL
Big Ideas Math A Bridge To Success Algebra 1: Stu...
Algebra
ISBN:9781680331141
Author:HOUGHTON MIFFLIN HARCOURT
Publisher:Houghton Mifflin Harcourt
Probability & Statistics (28 of 62) Basic Definitions and Symbols Summarized; Author: Michel van Biezen;https://www.youtube.com/watch?v=21V9WBJLAL8;License: Standard YouTube License, CC-BY
Introduction to Probability, Basic Overview - Sample Space, & Tree Diagrams; Author: The Organic Chemistry Tutor;https://www.youtube.com/watch?v=SkidyDQuupA;License: Standard YouTube License, CC-BY