
Concept explainers
Videos
Mercury Emissions by Continent By weight, coal does not contain much mercury, but we burn a lot of it. Several industries besides coal-fired power plants contribute substantially to atmospheric mercury pollution. FIGURE 2.13 shows mercury emissions by industry from different regions of the world in 2010.
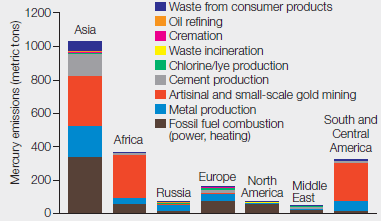
FIGURE 2.13 Global mercury emissions by sector, 2010.
About how many metric tons of mercury were released in total from these regions?
To determine: The total metric tons of mercury released from the regions given in the Fig. 2.13.
Introduction: Mercury is a toxic element and is naturally found in water, air, and soil. It is released in the environment through weathering of rocks, volcanic activity, and human activity. Human activity is mainly responsible for the mercury releases especially burning of coal in the coal-fired power stations, domestic uses, waste incinerators, industries, and mining of metals.
Explanation of Solution
As given in the problem statement, various industries besides coal-fired power plants contribute to mercury pollution in the atmosphere. Refer Fig. 2.13, “Global mercury emissions by sector, 2010” in the textbook. The graphical representation shows mercury emission (metric tons) by industries from different continents of the world in 2010. The data were reported from seven continents including Asia, Africa, Russia, Europe, North America, Middle East, and South and Central America. The mercury emissions released from various sectors included waste from consumer products, oil refining, cremation, waste incineration, mining, fossil fuel combustion, chlorine, cement, and metal production. On the basis of the data given in Fig. 2.13, Asia has the maximum mercury emissions reported as approximately 1100 metric tons. The approximate amount of mercury released by each continent is as follows:
- Asia – 1100 metric tons
- Africa – 380 metric tons
- South and Central America – 350 metric tons
- Europe – 180 metric tons
- North America – 80 metric tons
- Russia – 60 metric tons
- Middle East – 40 metric tons
By summing up the amount of mercury emissions from the seven continents, the total amount of mercury released (metric tons) comes to approximately 2200 metric tons.
The total mercury released by industry from different regions of the world in 2010 was 2200 metric tons.
Want to see more full solutions like this?
Chapter 2 Solutions
Biology: The Unity and Diversity of Life (MindTap Course List)
Additional Science Textbook Solutions
MARINE BIOLOGY
Essentials of Genetics (9th Edition) - Standalone book
HUMAN ANATOMY
Campbell Biology: Concepts & Connections (8th Edition)
Genetic Analysis: An Integrated Approach (2nd Edition)


- Mercury Emissions by Continent By weight, coal does not contain much mercury, but we burn a lot of it. Several industries besides coal-fired power plants contribute substantially to atmospheric mercury pollution. FIGURE 2.13 shows mercury emissions by industry from different regions of the world in 2010. FIGURE 2.13 Global mercury emissions by sector, 2010. About how many metric tons of mercury were released from metal production in Asia?arrow_forwardMercury Emissions by Continent By weight, coal does not contain much mercury, but we burn a lot of it. Several industries besides coal-fired power plants contribute substantially to atmospheric mercury pollution. FIGURE 2.13 shows mercury emissions by industry from different regions of the world in 2010. FIGURE 2.13 Global mercury emissions by sector, 2010. Which industry tops the list of mercury emitters? Which industry is next on the list?arrow_forwardMercury Emissions by Continent By weight, coal does not contain much mercury, but we burn a lot of it. Several industries besides coal-fired power plants contribute substantially to atmospheric mercury pollution. FIGURE 2.13 shows mercury emissions by industry from different regions of the world in 2010. FIGURE 2.13 Global mercury emissions by sector, 2010. Which region emitted the most mercury from burning fossil fuels?arrow_forward
- Environmentally conscious Susan has been told that a newelectric car will only generate 6 ounces of greenhouse gases (GHG) permile, but that a standard internal combustion car is double that at 12ounces per mile. However, the nature of electric cars is such that the new technology and electric batteries generate 30,000 lbs. of GHG to manu-facture and another 10,000 lbs. to recycle. A standard car generates only 14,000 lbs. of GHG to manufacture, and recycling with established tech-nology is only 1,000 lbs. Susan is interested in taking a systems approach that considers the life-cycle impact of her decision. How many miles mustshe drive the electric car for it to be the preferable decision in terms ofreducing greenhouse gases?arrow_forwardIn the figure illustrated, the sink for the material is in the atmosphere.True or falsearrow_forwardVolcanoes emit much hywdrogen sulfide gas, H2S, which reacts with the oxygen in the air to form water and sulfur dioxide, SO2. Every 83 tons of H2S reacts with 117 tons of oxygen and forms 44 tons of water. How many tons SO2 are formed.arrow_forward
- Why would increasing energy efficiency in homes and businesses across the united states reduce the bioaccumulation of mercury?arrow_forwardThe data in the table below was collected by researchers to investigate the oxygen concen- tration of water in a lake. Data was collected from the location in the lake at the same time every day repeatedly over a six-day period. Day A B n D 9.04 ppm Calculate the mean of the sample data. 0.63 ppm 1.65 ppm Day 1 1.12 ppm Day 2 Day 3 Day 4 Day 5 Day 6 Oxygen Concentration (ppm) 1.2 21 20 1.7 1.4 1.5arrow_forwardHow many people have died from direct radiation exposure as a result of the Fukushima Daiichi Nuclear Power Plant accident? 0. 23 176 O 1,154 7,258arrow_forward
- Lake surface 0 O2 2 Temperature Epilimnion Thermocline 8. Hypolimnion 10 H2S 12 14 Sediments16 4 6. 8. 10 O2 (mg/l) H2S (mg/l) 20 Temp (°C) 0. 1 4 12 16 Depth (m) 4-arrow_forwardIf a body of water is to support life, its dissolved oxygen should be _____ ppm or mg/L.arrow_forwardSince the US has blended more and more ethanol into its gasoline, US production of ethanol has increased through your lifetime, and the data in the chart below basically show this. But production of ethanol in the US dropped slightly in the year Annual World Fuel Ethanol Production (Mil. Gal.) % of World Production Region 2014 2015 2016 2017 2018 2019 54% 30% 5% 3% 16,061 15,800 14,807 7,200 15.936 6,860 1,400 United States 14313 15,413 Brazil 6,760 7,920 8,620 6,760 1377 European Union China 1445 1387 1,430 1,440 84S 900 500 635 813 860 1,050 Canada 510 436 436 470 480 India 85 195 275 210 400 530 2% Thailand 310 334 322 370 390 420 196 Argentina Rest of World 160 211 264 290 290 290 1% 865 391 490 414 549 600 2% Total 25.083 25,774 26,182 26,810 28,570 29,100arrow_forward
 Biology: The Unity and Diversity of Life (MindTap...BiologyISBN:9781337408332Author:Cecie Starr, Ralph Taggart, Christine Evers, Lisa StarrPublisher:Cengage Learning