
Concept explainers
Videos
Mercury Emissions by Continent By weight, coal does not contain much mercury, but we burn a lot of it. Several industries besides coal-fired power plants contribute substantially to atmospheric mercury pollution. FIGURE 2.13 shows mercury emissions by industry from different regions of the world in 2010.
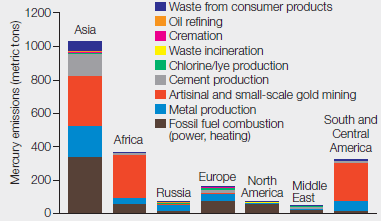
FIGURE 2.13 Global mercury emissions by sector, 2010.
About how many metric tons of mercury were released in total from these regions?
To determine: The total metric tons of mercury released from the regions given in the Fig. 2.13.
Introduction: Mercury is a toxic element and is naturally found in water, air, and soil. It is released in the environment through weathering of rocks, volcanic activity, and human activity. Human activity is mainly responsible for the mercury releases especially burning of coal in the coal-fired power stations, domestic uses, waste incinerators, industries, and mining of metals.
Explanation of Solution
As given in the problem statement, various industries besides coal-fired power plants contribute to mercury pollution in the atmosphere. Refer Fig. 2.13, “Global mercury emissions by sector, 2010” in the textbook. The graphical representation shows mercury emission (metric tons) by industries from different continents of the world in 2010. The data were reported from seven continents including Asia, Africa, Russia, Europe, North America, Middle East, and South and Central America. The mercury emissions released from various sectors included waste from consumer products, oil refining, cremation, waste incineration, mining, fossil fuel combustion, chlorine, cement, and metal production. On the basis of the data given in Fig. 2.13, Asia has the maximum mercury emissions reported as approximately 1100 metric tons. The approximate amount of mercury released by each continent is as follows:
- Asia – 1100 metric tons
- Africa – 380 metric tons
- South and Central America – 350 metric tons
- Europe – 180 metric tons
- North America – 80 metric tons
- Russia – 60 metric tons
- Middle East – 40 metric tons
By summing up the amount of mercury emissions from the seven continents, the total amount of mercury released (metric tons) comes to approximately 2200 metric tons.
The total mercury released by industry from different regions of the world in 2010 was 2200 metric tons.
Want to see more full solutions like this?
Chapter 2 Solutions
Biology: The Unity and Diversity of Life (MindTap Course List)
Additional Science Textbook Solutions
Biological Science (6th Edition)
Physical Science
Genetics: From Genes to Genomes
Campbell Essential Biology (7th Edition)
Microbiology Fundamentals: A Clinical Approach


- Biopharmaceutics and Pharmacokinetics:Two-Compartment Model Zero-Order Absorption Questions SHOW ALL WORK, including equation used, variables used and each step to your solution, report your regression lines and axes names (with units if appropriate) :Calculate a-q a) B1, b) B2, c) hybrid rate constant (1) d) hybrid rate constant (2) e) t1/2,dist f) t1/2,elim g) k10 h) k12 i) k21 j) initial concentration (C0) k) central compartment volume (V1) l) steady-state volume (Vss) m) clearance (CL) AUC (0→10 min) using trapezoidal rule n) AUC (20→30 min) using trapezoidal rule o) AUCtail (AUC360→∞) p) total AUC (using short cut method) q) volume from AUC (VAUC)arrow_forwardWhat are some external influences that keep people from making healthy eating decisions?arrow_forwardWhat type of structure(s) would you expect to see in peripheral membrane proteins? (mark all that apply) A. Amphipathic alpha helix (one side is hydrophilic and one side is hydrophobic) B. A hydrophobic beta barrel C. A hydrophobic alpha helix D. A chemical group attached to the protein that can anchor it to the membranearrow_forward
- Temporal flexibility (the ability to change over time) of actin structures within a cell is maintained by… A. The growth/shrinkage cycle B. Periodic catastrophe C. GTP hydrolysis D. Treadmilling E. None of the abovearrow_forwardDuring in vitro polymerization of actin and microtubule filaments from their subunits, what causes the initial delay in filament growth? A.Nucleation B.Reaching homeostasis C.Nucleotide exchange D.ATP or GTP hydrolysis E.Treadmillingarrow_forwardYou expect to find which of the following in the Microtubule Organizing Center (MTOC)...(mark all that apply) A. Gamma tubulin B. XMAP215 C. Centrioles D. Kinesin-13arrow_forward
- The actin-nucleating protein formin has flexible “arms” containing binding sites that help recruit subunits in order to enhance microfilament polymerization. What protein binds these sites? A.Thymosin B.Profilin C.Cofilin D.Actin E.Tropomodulinarrow_forwardWhile investigating an unidentified motor protein, you discover that it has two heads that bind to actin. Based on this information, you could confidently determine that it is NOT... (mark all that apply) A. A myosin I motor B. A dynein motor C. A myosin VI motor D. A kinesin motorarrow_forwardYou isolate the plasma membrane of cells and find that . . . A. it contains regions with different lipid compositions B. it has different lipid types on the outer and cytosolic leaflets of the membrane C. neither are possible D. A and B both occurarrow_forward
- You are studying the mobility of a transmembrane protein that contains extracellular domains, one transmembrane domain, and a large cytosolic domain. Under normal conditions, this protein is confined to a particular region of the membrane due to the cortical actin cytoskeletal network. Which of the following changes is most likely to increase mobility of this protein beyond the normal restricted region of the membrane? A. Increased temperature B. Protease cleavage of the extracellular domain of the protein C. Binding to a free-floating extracellular ligand, such as a hormone D. Protease cleavage of the cytosolic domain of the protein E. Aggregation of the protein with other transmembrane proteinsarrow_forwardTopic: Benthic invertebrates as an indicator species for climate change, mapping changes in ecosystems (Historical Analysis & GIS) What objects or events has the team chosen to analyze? How does your team wish to delineate the domain or scale in which these objects or events operate? How does that limited domain facilitate a more feasible research project? What is your understanding of their relationships to other objects and events? Are you excluding other things from consideration which may influence the phenomena you seek to understand? Examples of such exclusions might include certain air-born pollutants; a general class of water bodies near Ottawa, or measurements recorded at other months of the year; interview participants from other organizations that are involved in the development of your central topic or issue. In what ways do your research questions follow as the most appropriate and/or most practical questions (given the circumstances) to pursue to better understand…arrow_forwardThe Esp gene encodes a protein that alters the structure of the insulin receptor on osteoblasts and interferes with the binding of insulin to the receptor. A researcher created a group of osteoblasts with an Esp mutation that prevented the production of a functional Esp product (mutant). The researcher then exposed the mutant strain and a normal strain that expresses Esp to glucose and compared the levels of insulin in the blood near the osteoblasts (Figure 2). Which of the following claims is most consistent with the data shown in Figure 2 ? A Esp expression is necessary to prevent the overproduction of insulin. B Esp protein does not regulate blood-sarrow_forward
 Biology: The Unity and Diversity of Life (MindTap...BiologyISBN:9781337408332Author:Cecie Starr, Ralph Taggart, Christine Evers, Lisa StarrPublisher:Cengage Learning
 BiochemistryBiochemistryISBN:9781305577206Author:Reginald H. Garrett, Charles M. GrishamPublisher:Cengage Learning
 Biology: The Unity and Diversity of Life (MindTap...BiologyISBN:9781305073951Author:Cecie Starr, Ralph Taggart, Christine Evers, Lisa StarrPublisher:Cengage Learning
 Biology 2eBiologyISBN:9781947172517Author:Matthew Douglas, Jung Choi, Mary Ann ClarkPublisher:OpenStax
 Biology Today and Tomorrow without Physiology (Mi...BiologyISBN:9781305117396Author:Cecie Starr, Christine Evers, Lisa StarrPublisher:Cengage Learning