Concept explainers
Starting from rest, a car accelerates at a constant rate of 4.0 m/s2 for a time of 5 seconds.
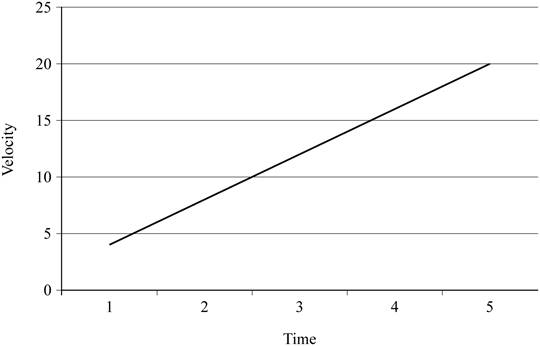
- a. Compute the velocity of the car at 1 s, 2 s, 3 s, 4 s, and 5 s and plot these velocity values against time.
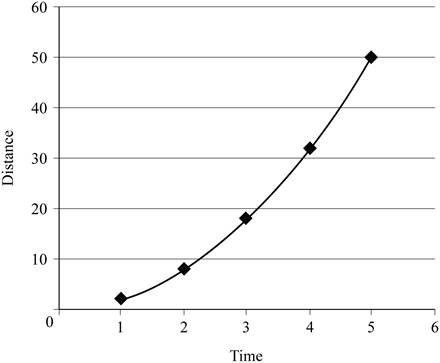
- b. Compute the distance traveled by the car for these same times and plot the distance values against time.
(a)
The velocity of the car after each second.
Answer to Problem 18E
The velocities after 1s, 2s, 3s, 4s and 5s are 4 m/s, 8 m/s, 12 m/s, 16 m/s and 20 m/s respectively.
Explanation of Solution
Given info: Acceleration is
Write the formula for average acceleration.
Here,
a is the average acceleration
t is the time
Re-arrange the above equation to get
For
Substitute 0 m/s for
For
Substitute 0 m/s for
For
Substitute 0 m/s for
For
Substitute 0 m/s for
For
Substitute 0 m/s for
The velocity time graph is given below.

Conclusion:
The velocities after 1s, 2s, 3s, 4s and 5s are 4 m/s, 8 m/s, 12 m/s, 16 m/s and 20 m/s respectively.
(b)
The distance travelled after each second.
Answer to Problem 18E
The distances after 1s, 2s, 3s, 4s and 5s are 2 m, 8 m, 18 m, 32 m and 50 m respectively.
Explanation of Solution
Given info: Acceleration is
Write the formula to calculate the distance.
Here,
d is the distance
For
Substitute 0 m/s for
For
Substitute 0 m/s for
For
Substitute 0 m/s for
For
Substitute 0 m/s for
For
Substitute 0 m/s for
The distance time graph is,

Conclusion:
The distances after 1s, 2s, 3s, 4s and 5s are 2 m, 8 m, 18 m, 32 m and 50 m respectively.
Want to see more full solutions like this?
Chapter 2 Solutions
Physics of Everyday Phenomena
- A cyclist rides 8.0 km east for 20 minutes, then he turns and heads west for 8 minutes and 3.2 km. Finally, he rides east for 16 km, which takes 40 minutes. (a) What is the final displacement of the cyclist? (b) What is his average velocity?arrow_forwardAn object that moves in one dimension has the velocity-versus-time graph shown in Figure P2.52. At time t = 0, the object has position x = 0. a. At time t = 5 s. is the acceleration of the object positive, negative, or zero? Explain. b. At time t = 8 s, is the object speeding up, showing down, or moving with constant speed? Explain. c. Write an expression for the position of the object as a function of time. Explain how you use the graph to obtain your answer. d. Use your expression from part (c) to determine the time (if any) at which the object reaches its maximum position. Check your results by examining the graph. Hint: To get started with finding the maximum of a function, take the derivative and set it equal to zero.arrow_forwardAn express train passes through a station. It enters with an initial velocity of 22.0 m/s and decelerates at a rate of 0.150m/s2 as it goes through. The station in 210.0 m long. (a) How fast is it going when the nose leaves the station? (b) How long is the nose of the train in the station? (c) If the train is 130 m long, what is the velocity of the end of the train as it leaves? (d) When does the end of the train leave the station?arrow_forward
- (a) A light-rail commuter train accelerates at a rate of 1.35m/s2 . How long does it take to reach its top speed of 80.0 km/h, starting from rest? (b) The same train ordinarily decelerates at a rate of 1.65m/s2 . How long does it take to came to a stop from its top speed? (c) In emergencies, the train can decelerate more rapidly, coming to rest from 80.0 km/h in 8.30 s. What is its emergency acceleration in meters per second sqquared?arrow_forwardA motorist drives for 35.0 minutes at 85.0 km/h and then stops for 15.0 minutes. He then continues north, traveling 130. Km in 2.00 h. (a) What is his total displacement? (b) What is his average velocity?arrow_forwardThe Acela is an electric train on the WashingtonNew YorkBoston run, carrying passengers at 170 mi/h. A velocitytime graph for the Acela is shown in Figure P2.46. (a) Describe the trains motion in each successive time interval. (b) Find the trains peak positive acceleration in the motion graphed. (c) Find the trains displacement in miles between t = 0 and t = 200 s. Figure P2.46 Velocity versus time graph for the Acela.arrow_forward
- The Acela is an electric train on the Washington-New YorkBoston run, carrying passengers at 170 mi/h. A velocity-time graph for the Acela is shown in Figure P2.69. (a) Describe the train's motion in each successive lime interval, (b) Find the trains peak positive acceleration in the motion graphed, (c) Find the trains displacement in miles between t = 0 and t = 200 s.arrow_forwardA student drives a moped along a straight road as described by the velocity-versus-time graph in Figure P2.12. Sketch this graph in the middle of a sheet of graph paper. (a) Directly above your graph, sketch a graph of the position versus time, aligning the time coordinates of the two graphs. (b) Sketch a graph of the acceleration versus time directly below the velocity-versus-time graph, again aligning the time coordinates. On each graph, show the numerical values of x and ax for all points of inflection. (c) What is the acceleration at t = 6.00 s? (d) Find the position (relative to the starting point) at t = 6.00 s. (e) What is the mopeds final position at t = 9.00 s? Figure P2.12arrow_forwardA speedboat travels in a straight line and increases in speed uniformly from vi = 20.0 m/s to vf = 30.0 m/s in a displacement x of 200 m. We wish to find the time interval required for the boat to move through this displacement. (a) Draw a coordinate system for this situation. (b) What analysis model is most appropriate for describing this situation? (c) From the analysis model, what equation is most appropriate for finding the acceleration of the speedboat? (d) Solve the equation selected in part (c) symbolically for the boats acceleration in terms of vi, vf, and x. (e) Substitute numerical values to obtain the acceleration numerically. (f) Find the time interval mentioned above.arrow_forward
- A person walks first at a constant speed of 5.00 m/s along a straight line from point to point and then back along the line from to at a constant speed of 3.00 m/s. (a) What is her average speed over the entire trip? (b) What is her average velocity over the entire trip?arrow_forwardA glider of length moves through a stationary photogate on an air track. A photogate (Fig. P2.44) is a device that measures the time interval td during which the glider blocks a beam of infrared light passing across the photogate. The ratio vd = /td is the average velocity of the glider over this part of its motion. Suppose the glider moves with constant acceleration. (a) Argue for or against the idea that vd is equal to the instantaneous velocity of the glider when it is halfway through the photogate in space. (b) Argue for or against the idea that vd is equal to the instantaneous velocity of the glider when it is halfway through the photogate in time.arrow_forwardAn object moves with a constant acceleration of 4.00 m/s2 and over a time interval reaches a final velocity of 12.0 m/s. a. If its original velocity is 6.00 m/s, what is its displacement during the time interval? b. What is the distance it travels during this interval? c. If its original velocity is 26.00 m/s, what is its displacement during this interval? d. What is the total distance it travels during the interval in part (c)?arrow_forward
 University Physics Volume 1PhysicsISBN:9781938168277Author:William Moebs, Samuel J. Ling, Jeff SannyPublisher:OpenStax - Rice University
 College PhysicsPhysicsISBN:9781305952300Author:Raymond A. Serway, Chris VuillePublisher:Cengage Learning
 Principles of Physics: A Calculus-Based TextPhysicsISBN:9781133104261Author:Raymond A. Serway, John W. JewettPublisher:Cengage Learning
 Glencoe Physics: Principles and Problems, Student...PhysicsISBN:9780078807213Author:Paul W. ZitzewitzPublisher:Glencoe/McGraw-Hill
 Physics for Scientists and Engineers, Technology ...PhysicsISBN:9781305116399Author:Raymond A. Serway, John W. JewettPublisher:Cengage Learning
 College PhysicsPhysicsISBN:9781938168000Author:Paul Peter Urone, Roger HinrichsPublisher:OpenStax College


