
The question requires us to determine the
Explanation of Solution
The following graph represents the PPC for potatoes and fish in the Atlantis economy:
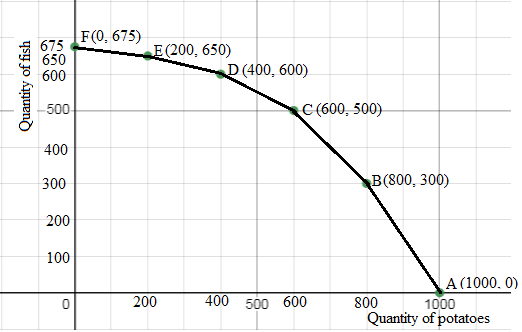
To increase the annual output of potatoes from 600 to 800 pounds (movement from point C to point B in the graph), the economy needs to reduce the fish production from 500 to 300 pounds to stay efficient. This fall in the fish production (200 units) represents the opportunity cost of increasing the annual production of potatoes.
The opportunity cost of producing potatoes = 500 − 300 = 200 pounds of fish.
Thus, the opportunity cost of increasing production of the annual output of potatoes from 600 to 800 pounds is 200 pounds of fish that the producer has to foregone to gain potatoes.
Therefore, option “a” is correct.
The
Chapter 1R Solutions
Krugman's Economics For The Ap® Course


 Principles of Economics (12th Edition)EconomicsISBN:9780134078779Author:Karl E. Case, Ray C. Fair, Sharon E. OsterPublisher:PEARSON
 Engineering Economy (17th Edition)EconomicsISBN:9780134870069Author:William G. Sullivan, Elin M. Wicks, C. Patrick KoellingPublisher:PEARSON
 Principles of Economics (MindTap Course List)EconomicsISBN:9781305585126Author:N. Gregory MankiwPublisher:Cengage Learning
 Managerial Economics: A Problem Solving ApproachEconomicsISBN:9781337106665Author:Luke M. Froeb, Brian T. McCann, Michael R. Ward, Mike ShorPublisher:Cengage Learning
 Managerial Economics & Business Strategy (Mcgraw-...EconomicsISBN:9781259290619Author:Michael Baye, Jeff PrincePublisher:McGraw-Hill Education