
a)
The question requires us to draw the production possibilities curve for Romano farms.
a)
Explanation of Solution
The following graph represents the production possibilities curve for Romano farms:
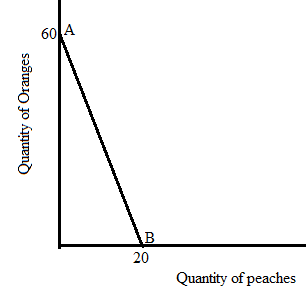
The line AB in the above graph is representing the production possibilities curve for Romano farms where X-axis shows the quantity of peaches, and y-axis shows the quantity of oranges.
The
b)
The question requires us to determine the
b)
Explanation of Solution
Opportunity cost is the next best alternative option that a person chooses. It is result of choosing one best option while forgoing next best alternative option.
Field farm’s opportunity cost of producing one bushels of peaches is 2 (=80/40) bushels of oranges.
c)
The question requires us to determine the specialization of firms, and decide whether the term of trade of four oranges in exchange for one peach is acceptable or not.
c)
Explanation of Solution
(i) To have specialization in a product the country should have a
Fields farm’s opportunity cost of producing one bushels of peaches = 80/40 = 2 bushels of oranges.
Romano farm’s opportunity cost of producing one bushels of peaches = 60/20 = 3 bushels of oranges. The opportunity cost of producing peaches is lower in field farms. So, field farm has a comparative advantage in producing peaches which indicates that field farm has specialization in the production of peaches.
(ii) Fields farm’s opportunity cost of producing one bushels of oranges = 40/80 = 0.5 bushels of peaches.
Romano farm’s opportunity cost of producing one bushels of oranges = 20/60 = 0.33 bushels of peaches.
When field farm has specialization in producing peaches, the terms of trade will be between the 2 bushels of oranges and 0.5 bushels of peaches.
So, the terms of trade of 4 oranges in exchange for one peach would be acceptable to both farms because the exchange rate is higher than the opportunity costs of oranges and peaches for both farms.
- The country with a lower opportunity cost of producing a product will have a comparative advantage in producing that product.
- The country with high production of a product in absolute terms will have an
absolute advantage in producing that product. - The rate at which one commodity can be exchanged for another is known as terms of trade.
d)
The question requires us to determine the impact of new technology on the production possibilities curve.
d)
Explanation of Solution
The following graph represents the impact of improved technology for peaches:
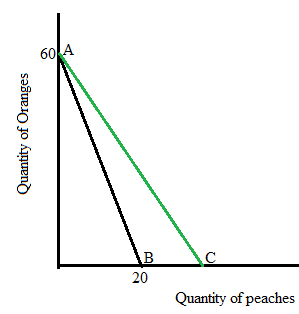
When farmers get improved technology for peaches, the production of peaches will rise and results in an outward movement of the PPC on axis representing the quantity of peaches.
The line AC shows the new production possibilities curve.
Chapter 1R Solutions
Krugman's Economics For The Ap® Course


 Principles of Economics (12th Edition)EconomicsISBN:9780134078779Author:Karl E. Case, Ray C. Fair, Sharon E. OsterPublisher:PEARSON
 Engineering Economy (17th Edition)EconomicsISBN:9780134870069Author:William G. Sullivan, Elin M. Wicks, C. Patrick KoellingPublisher:PEARSON
 Principles of Economics (MindTap Course List)EconomicsISBN:9781305585126Author:N. Gregory MankiwPublisher:Cengage Learning
 Managerial Economics: A Problem Solving ApproachEconomicsISBN:9781337106665Author:Luke M. Froeb, Brian T. McCann, Michael R. Ward, Mike ShorPublisher:Cengage Learning
 Managerial Economics & Business Strategy (Mcgraw-...EconomicsISBN:9781259290619Author:Michael Baye, Jeff PrincePublisher:McGraw-Hill Education