
The question requires us to identify the true option about the
Explanation of Solution
The following graph represents the PPC for potatoes and fish in the Atlantis economy:
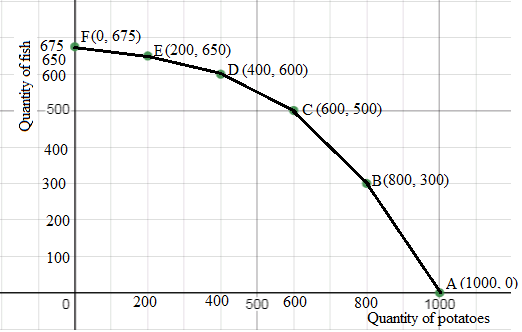
Atlantis has to decrease the production of fish to increase the production of potatoes. The above graph represents that with each increasing production of potatoes, the foregone quantity of fish rises continuously. The following table represents the opportunity costs of producing more potatoes:
| Quantity of potatoes | Opportunity cost of producing more potatoes in terms of fish. |
| 0 | - |
| 200 | 25 |
| 400 | 50 |
| 600 | 100 |
| 800 | 200 |
| 1000 | 300 |
So, opportunity cost of producing more potatoes is rising continually.
Option “b” is correct.
The
Chapter 1R Solutions
Krugman's Economics For The Ap® Course


 Principles of Economics (12th Edition)EconomicsISBN:9780134078779Author:Karl E. Case, Ray C. Fair, Sharon E. OsterPublisher:PEARSON
 Engineering Economy (17th Edition)EconomicsISBN:9780134870069Author:William G. Sullivan, Elin M. Wicks, C. Patrick KoellingPublisher:PEARSON
 Principles of Economics (MindTap Course List)EconomicsISBN:9781305585126Author:N. Gregory MankiwPublisher:Cengage Learning
 Managerial Economics: A Problem Solving ApproachEconomicsISBN:9781337106665Author:Luke M. Froeb, Brian T. McCann, Michael R. Ward, Mike ShorPublisher:Cengage Learning
 Managerial Economics & Business Strategy (Mcgraw-...EconomicsISBN:9781259290619Author:Michael Baye, Jeff PrincePublisher:McGraw-Hill Education