
Horngren's Cost Accounting: A Managerial Emphasis (16th Edition)
16th Edition
ISBN: 9780134475585
Author: Srikant M. Datar, Madhav V. Rajan
Publisher: PEARSON
expand_more
expand_more
format_list_bulleted
Videos
Textbook Question
Chapter 19, Problem 19.18E
Costs of quality. (CMA, adapted) Osborn, Inc., produces cell phone equipment. Amanda Westerly, Osborn’s president, implemented a quality-improvement program that has now been in operation for 2 years. The cost report shown here has recently been issued.
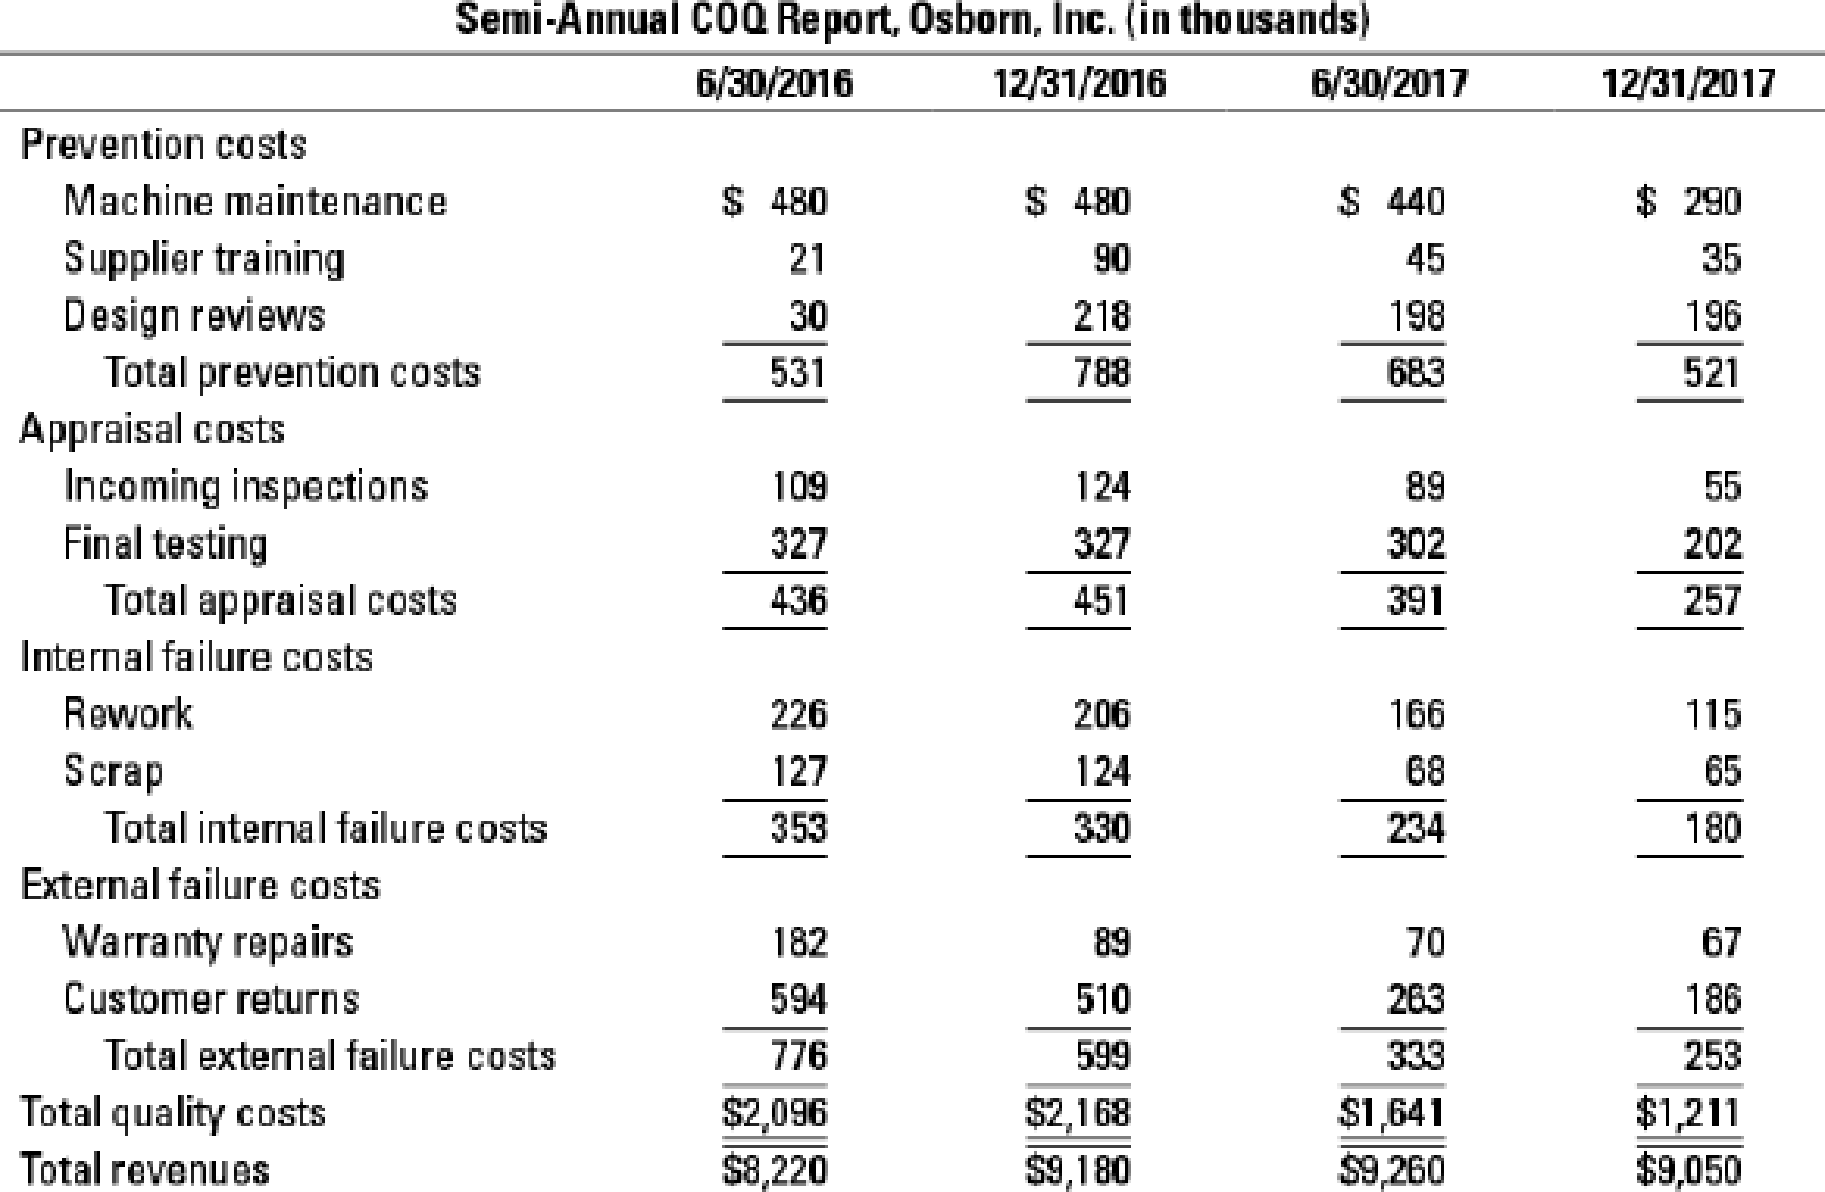
- 1. For each period, calculate the ratio of each COQ category to revenues and to total quality costs.
Required
- 2. Based on the results of requirement 1, would you conclude that Osborn’s quality program has been successful? Prepare a short report to present your case.
- 3. Based on the 2015 survey, Amanda Westerly believed that Osborn had to improve product quality. In making her case to Osborn management, how might Westerly have estimated the opportunity cost of not implementing the quality-improvement program?
Expert Solution & Answer

Trending nowThis is a popular solution!

Students have asked these similar questions
Costs of quality. (CMA, adapted) Osborn, Inc., produces cell phone equipment. Amanda Westerly, Osborn’s president, implemented a quality-improvement program that has now been in operation for 2 years. The cost report shown here has recently been issued.
In response to intense foreign competition, Florex Company has taken steps to improve the quality of its products. A summary of its
quality costs (in thousands) over the past two years is given below:
Inspection
Quality engineering
Depreciation of test equipment
Rework labor
Statistical process control
Cost of field servicing
Prevention costs:
Total prevention costs
Appraisal costs
Total appraisal costs
Internal failure costs:
Total internal failure costs
External failure costs:
Costs (in thousands)
Last Year This Year
$ 630
$ 918
$ 540
$ 720
$ 180
Supplies used in testing
Systems development
Warranty repairs
Net cost of scrap
Product testing
Product recalls
$ 720
$ 990
$ 2,610
Disposal of production defects
$ 900
Sales have been flat over the past few years, at $90,000,000 per year.
Required:
1. Prepare a quality cost report for this year and last year.
Note: Enter amount values in thousands. Round your percentage answers to 2 decimal places (i.e 0.1234 should be entered as
12.34).…
The production department is proposing the purchase of an automatic insertion machine. It has identified three machines and has asked the accountant to analyze them to determine
which one has the best average rate of return.
Machine A Machine B Machine C
$83,087.40 $73,001.40
322,364.00 276,958.00 486,676.00
Estimated average income $45,130.96
Average investment
Oa. Machine B
Ob. Machine C
Oc. Machine A
Od. Machines B and C have the same preferred average rate of return.
Chapter 19 Solutions
Horngren's Cost Accounting: A Managerial Emphasis (16th Edition)
Ch. 19 - Describe two benefits of improving quality.Ch. 19 - Prob. 19.2QCh. 19 - Name two items classified as prevention costs.Ch. 19 - Give two examples of appraisal costs.Ch. 19 - Distinguish between internal failure costs and...Ch. 19 - Describe three methods that companies use to...Ch. 19 - Companies should focus on financial measures of...Ch. 19 - Give two examples of nonfinancial measures of...Ch. 19 - Give two examples of nonfinancial measures of...Ch. 19 - When evaluating alternative ways to improve...
Ch. 19 - Distinguish between customer-response time and...Ch. 19 - Prob. 19.12QCh. 19 - Give two reasons why delays occur.Ch. 19 - Companies should always make and sell all products...Ch. 19 - Prob. 19.15QCh. 19 - Rector Corporation is examining its quality...Ch. 19 - Six Sigma is a continuous quality improvement...Ch. 19 - Costs of quality. (CMA, adapted) Osborn, Inc.,...Ch. 19 - Costs of quality analysis. Adirondack Company...Ch. 19 - Costs-of-quality analysis. Safe Travel produces...Ch. 19 - Costs of quality, quality improvement. iCover...Ch. 19 - Prob. 19.22ECh. 19 - Prob. 19.23ECh. 19 - Waiting time. Its a Dogs World (IDW) makes toys...Ch. 19 - Waiting time, service industry. The registration...Ch. 19 - Waiting time, cost considerations, customer...Ch. 19 - Nonfinancial measures of quality and time. For the...Ch. 19 - Nonfinancial measures of quality, manufacturing...Ch. 19 - Statistical quality control. Harvest Cereals...Ch. 19 - Quality improvement, Pareto diagram,...Ch. 19 - Quality improvement, relevant costs, and relevant...Ch. 19 - Quality improvement, relevant costs, and relevant...Ch. 19 - Waiting times, manufacturing cycle times. The...Ch. 19 - Prob. 19.34PCh. 19 - Manufacturing cycle times, relevant revenues, and...Ch. 19 - Compensation linked with profitability, waiting...Ch. 19 - Ethics and quality. Weston Corporation...Ch. 19 - Prob. 19.38P
Knowledge Booster


Learn more about
Need a deep-dive on the concept behind this application? Look no further. Learn more about this topic, accounting and related others by exploring similar questions and additional content below.Similar questions
- The controller of Emery, Inc. has computed quality costs as a percentage of sales for the past 5 years (20X1 was the first year the company implemented a quality improvement program). This information is as follows: Required: 1. Prepare a trend graph for total quality costs. Comment on what the graph has to say about the success of the quality improvement program. 2. Prepare a graph that shows the trend for each quality cost category. What does the graph have to say about the success of the quality improvement program? Does this graph supply more insight than the total cost trend graph does? 3. Prepare a graph that compares the trend in relative control costs versus relative failure costs. Comment on the significance of this trend.arrow_forwardSuppose that Kicker had the following sales and cost experience (in thousands of dollars) for May of the current year and for May of the prior year: In May of the prior year, Kicker started an intensive quality program designed to enable it to build original equipment manufacture (OEM) speaker systems for a major automobile company. The program was housed in research and development. In the beginning of the current year, Kickers accounting department exercised tighter control over sales commissions, ensuring that no dubious (e.g., double) payments were made. The increased sales in the current year required additional warehouse space that Kicker rented in town. (Round ratios to four decimal places. Round sales dollars computations to the nearest dollar.) Required: 1. Calculate the contribution margin ratio for May of both years. 2. Calculate the break-even point in sales dollars for both years. 3. Calculate the margin of safety in sales dollars for both years. 4. CONCEPTUAL CONNECTION Analyze the differences shown by your calculations in Requirements 1, 2, and 3.arrow_forwardGagnon Company reported the following sales and quality costs for the past four years. Assume that all quality costs are variable and that all changes in the quality cost ratios are due to a quality improvement program. Required: 1. Compute the quality costs for all four years. By how much did net income increase from Year 1 to Year 2 because of quality improvements? From Year 2 to Year 3? From Year 3 to Year 4? 2. The management of Gagnon Company believes it is possible to reduce quality costs to 2.5 percent of sales. Assuming sales will continue at the Year 4 level, calculate the additional profit potential facing Gagnon. Is the expectation of improving quality and reducing costs to 2.5 percent of sales realistic? Explain. 3. Assume that Gagnon produces one type of product, which is sold on a bid basis. In Years 1 and 2, the average bid was 400. In Year 1, total variable costs were 250 per unit. In Year 3, competition forced the bid to drop to 380. Compute the total contribution margin in Year 3 assuming the same quality costs as in Year 1. Now, compute the total contribution margin in Year 3 using the actual quality costs for Year 3. What is the increase in profitability resulting from the quality improvements made from Year 1 to Year 3?arrow_forward
- Nicholson Co sells mobile telephones. It supplies its customers with telephones and wireless telephone connections. Customers pay an annual fee plus a monthly charge based on calls made. The company has recently employed a consultant to install a balanced scorecard system of performance measurement and to benchmark the results against those of Nicholson Co's competitors. Unfortunately the consultant was called away before the work was finished. You have been asked to complete the work. The following data is available. Nicholson Co Operating data for the year ended 30 November 2013 Sales revenue $480 million Sales attributable to new products $8 million Average capital employed $192 million Profit before interest and tax $48 million Average number of customers 1,960,000 Average number of telephones returned for repair each day 10,000 Number of bill queries 12,000 Number of customer complaints 21,600 Number of customers lost 117,600 Average number of telephones unrepaired at the end of…arrow_forwardNicholson Co sells mobile telephones. It supplies its customers with telephones and wireless telephone connections. Customers pay an annual fee plus a monthly charge based on calls made.The company has recently employed a consultant to install a balanced scorecard system of performance measurement and to benchmark the results against those of Nicholson Co’s competitors. Unfortunately the consultant was called away before the work was finished. You have been asked to complete the work. The following data is available.Nicholson Co Operating data for the year ended 30 November 2013 Sales revenue $480 millionSales attributable to new products $8 millionAverage capital employed $192 millionProfit before interest and tax $48 millionAverage numbers of customers 1,960,000Average number of telephones returned for repair each year 10,000Number of bill queries 12,000Number of customer complaints 21,600Number of customers lost 117,600Average number of telephones unrepaired at the end of each day…arrow_forwardDataSpan, Inc., automated its plant at the start of the current year and installed a flexiblemanufacturing system. The company is also evaluating its suppliers and moving toward LeanProduction. Many adjustment problems have been encountered, including problems relating toperformance measurement. After much study, the company has decided to use the performancemeasures below, and it has gathered data relating to these measures for the first four months ofoperations.Month1 2 3 4Throughput time (days) ? ? ? ?Delivery cycle time (days) ? ? ? ?Manufacturing cycle efficiency (MCE) ? ? ? ?Percentage of on-time deliveries 91% 86% 82% 78%Total sales (units) 3460 3312 3143 3025Management has asked for your help in computing throughput time, delivery cycle time, and MCE.The following average times have been logged over the last four months: Average per Month (in days)1 2 3 4Move time per unit 0.7 0.5 0.6 0.6Process time per unit 2.8 2.7 2.6 2.5Wait time per order before start of production 23.0…arrow_forward
- The production department is proposing the purchase of an automatic insertion machine. It has identified three machines and has asked the accountant to analyze them to determine which one has the best average rate of return. Machine A $43,529.50 $80,697.00 Machine B Machine C $64,675.95 310,925.00 268,990.00 431,173.00 Estimated average income Average investment Oa. Machine B Ob. Machine A Oc. Machine C Od. Machines B and C have the same preferred average rate of return.arrow_forwardNicholson Co sells mobile telephones. It supplies its customers with telephones and wireless telephone connections. Customers pay an annual fee plus a monthly charge based on calls made. The company has recently employed a consultant to install a balanced scorecard system of performance measurement and to benchmark the results against those of Nicholson Co's competitors. Unfortunately the consultant was called away before the work was finished. You have been asked to complete the work. The following data is available. Nicholson Co Operating data for the year ended 30 November 2013 Sales revenue $480 million Sales attributable to new products $8 million Average capital employed $192 million Profit before interest and tax $48 million Average number of customers 1,960,000 Average number of telephones returned for repair each day 10,000 Number of bill queries 12,000 Number of customer complaints 21,600 Number of customers lost 117,600 Average number of telephones unrepaired at the end of…arrow_forwardCost-of-Quality (COQ) Analysis; Nonfinancial Performance Measures (Note: This problemcan be solved as a spreadsheet application and should be set up on a spreadsheet if Problem 17-71 isalso assigned.) Acme Materials Company manufactures and sells synthetic coatings that can withstand high temperatures. Its primary customers are aviation manufacturers and maintenance companies. The following table contains financial information pertaining to cost of quality (COQ) in 2019and 2020 (in thousands of dollars):[LO 17-5, 17-6]2019 2020Sales $16,000 $20,000Materials inspection 300 60In-process (production) inspection 160 125Finished product inspection 250 70Preventive equipment maintenance 20 60Scrap (net) 500 300Warranty repairs 700 450Product design engineering 150 270Vendor certification 10 60Direct costs of returned goods 275 80Training of factory workers 40 140Product testing—equipment maintenance 60 60Product testing labor 210 90Field repairs 70 40Rework before shipment 240…arrow_forward
- At the end of 2021, Mejorar Company implemented a low-cost strategy to improve its competitive position. Its objective was to become the low-cost producer in its industry. A Balanced Scorecard was developed to guide the company toward this objective. To lower costs, Mejorar undertook a number of improvement activities such as JIT production, total quality management, and activity-based management. Now, after two years of operation, the president of Mejorar wants some assessment of the achievements. To help provide this assessment, the following information on one product has been gathered: 1. Compute the following measures for 2021 and 2023: a. actual velocity and cycle time (2021 and 2023) (My question: In the book it stated that Actual Velocity (# units produced/time) and Cycle Time (time/# units produced) However, which one is per hour and per minute Or maybe I wrong let me know?) b. Percentage of total revenue from new customers (2021 and 2023) (assume one unit per customer) c.…arrow_forwardNicholson Co sells mobile telephones. It supplies its customers with telephones and wireless telephone connections. Customers pay an annual fee plus a monthly charge based on calls made. The company has recently employed a consultant to install a balanced scorecard system of performance measurement and to benchmark the results against those of Nicholson Co's competitors. Unfortunately the consultant was called away before the work was finished. You have been asked to complete the work. The following data is available. Nicholson Co Operating data for the year ended 30 November 2013 Sales revenue $480 million Sales attributable to new products $8 million Average capital employed $192 million Profit before interest and tax $48 million Average number of customers 1,960,000 Average number of telephones returned for repair each day 10,000 Number of bill queries 12,000 Number of customer complaints 21,600 Number of customers lost 117,600 Average number of telephones unrepaired at the end of…arrow_forwardThe production department is proposing the purchase of an automatic insertion machine. It has identified three machines and has asked the accountant to analyze them to determine which one has the best average rate of return. Line Item Description Machine A Machine B Machine C Estimated average income $47,060.44 $72,961.50 $73,785.60 Average investment 336,146.00 243,205.00 491,904.00 a. Machine C b. Machine A c. Machines B and C have the same preferred average rate of return. d. Machine Barrow_forward
arrow_back_ios
SEE MORE QUESTIONS
arrow_forward_ios
Recommended textbooks for you
 Cornerstones of Cost Management (Cornerstones Ser...AccountingISBN:9781305970663Author:Don R. Hansen, Maryanne M. MowenPublisher:Cengage Learning
 Managerial Accounting: The Cornerstone of Busines...AccountingISBN:9781337115773Author:Maryanne M. Mowen, Don R. Hansen, Dan L. HeitgerPublisher:Cengage Learning
Cornerstones of Cost Management (Cornerstones Ser...
Accounting
ISBN:9781305970663
Author:Don R. Hansen, Maryanne M. Mowen
Publisher:Cengage Learning
Managerial Accounting: The Cornerstone of Busines...
Accounting
ISBN:9781337115773
Author:Maryanne M. Mowen, Don R. Hansen, Dan L. Heitger
Publisher:Cengage Learning
Understanding Systems Development Life Cycle; Author: GreggU;https://www.youtube.com/watch?v=shNOYFlmBOU;License: Standard Youtube License