
Campbell Essential Biology (7th Edition)
7th Edition
ISBN: 9780134765037
Author: Eric J. Simon, Jean L. Dickey, Jane B. Reece
Publisher: PEARSON
expand_more
expand_more
format_list_bulleted
Concept explainers
Videos
Textbook Question
Chapter 19, Problem 12PS
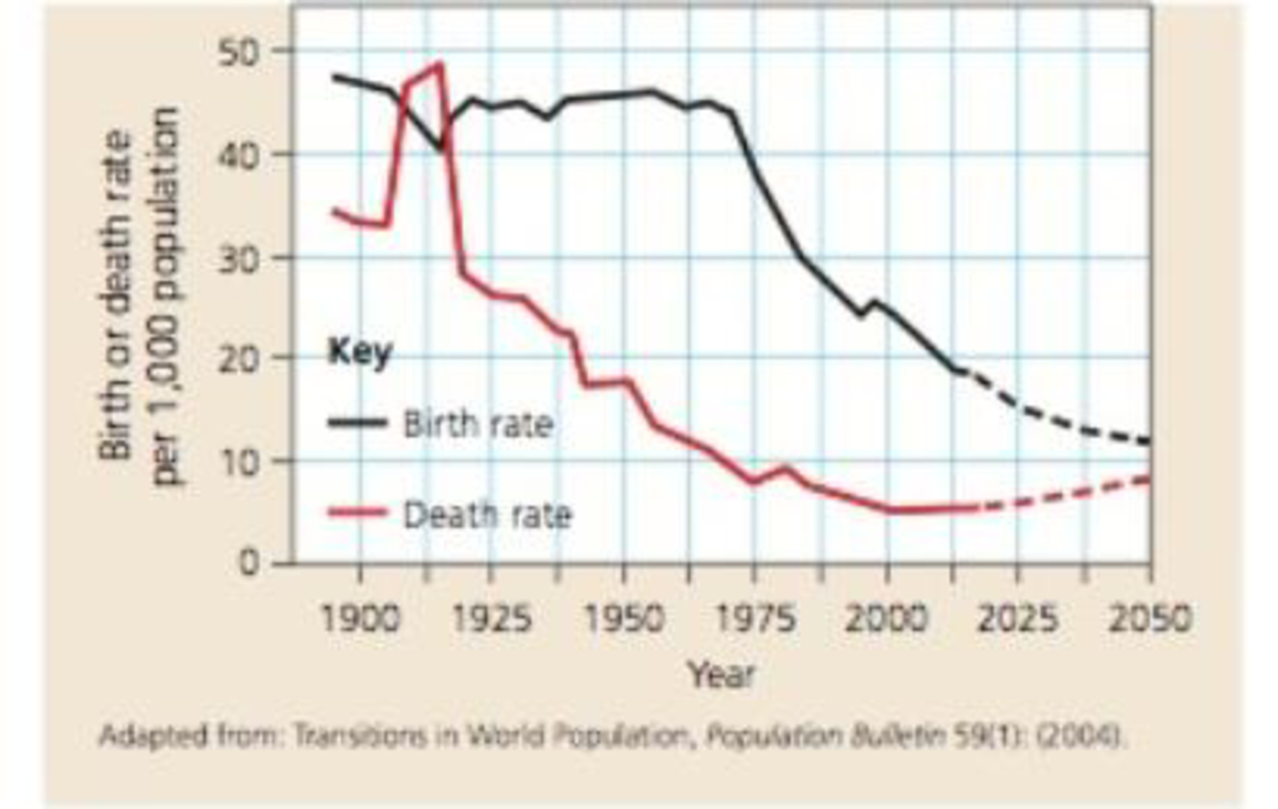
Interpreting Data The graph below shows data for population trends in Mexico from 1890 to 2016, with projected trends for 2016–2050. How has Mexico's rate of population growth changed over this time period? How is it expected to change by midcentury? Describe Mexico's projected age structure in 2050.
Expert Solution & Answer
Want to see the full answer?
Check out a sample textbook solution
Students have asked these similar questions
Shown is an age pyramid of Brazil in the year 2021. Describe its shape. What does the shape of the age pyramid tell you about their population? What can be said about the birth rates and death rates.
Population Growth (continued)
The graph below shows the population of Peregrine falcons in the United States (excluding Alaska and Hawaii). Look at the graph, then answer the questions below.
1,800
American peregrine falcon
1,600
Lower 48 States
1,400
1,200
1,000
800
600
400
200
1970
1972
1976
1978
1980
1982
1984
What type of growth is exhibited by this population?
1986
1988
1992
1994
Center for Biological Diversity
cyclical
expotential
logistic
susainable
Breeding Pairs
1974
1990
1996
1998
This graph represents two lines that
show
World Population Growth, 1750-2150
2150
2100
2050
2000
1950
1900
1850
1800
1750
0
2
4
6
8
10 12
Population in rural areas and population in
urban areas
Population in developed countries and
population in developing countries
Population billions
Industrialized
Countries
Developing
Economically
1999
O
O Exponential growth
O Logistic growth
Chapter 19 Solutions
Campbell Essential Biology (7th Edition)
Ch. 19 - What two values would you need to know to figure...Ch. 19 - If members of a species produce a large number of...Ch. 19 - Prob. 3SQCh. 19 - Prob. 4SQCh. 19 - Prob. 5SQCh. 19 - Prob. 6SQCh. 19 - According to data on ecological footprints, a. the...Ch. 19 - The mussel secretes a combination of molecules...Ch. 19 - The lynx is one of the main predators of the...Ch. 19 - Life history traits, like anatomical features, are...
Knowledge Booster


Learn more about
Need a deep-dive on the concept behind this application? Look no further. Learn more about this topic, biology and related others by exploring similar questions and additional content below.Similar questions
- 3 oBook References Classify each of the following descriptions by its effect on human population growth rates. Low death rate compared to birth rate First phase of demographic transition A population close to its carrying capacity Low birth rate Outbreak of deadly infectious diseases High mortality rate Second phase of demographic transition Current conditions in India Low population growth High population growtharrow_forwardThe Arizona Forest occupies 87,174,334,009 sq. miles land that cater different kinds of species. One of which were the leopards. As of 2019, the total population of leopards is 26,753. Due to severe changes of the environment, there is an average of 571 leopard’s dies while only 255 were given birth each year. In 1950, their population is 63% higher from the current population. Calculate for: Population Growth rate Select one: a. 244.26% b. 244. 25% c. 244. 28% d. 244.29%arrow_forwardWhich country looks like it is experiencing exponential growth? Which country looks like it has reached its carrying capacity? Because it has reached its carrying capacity, describe the relationship between its birth rates and death rates. Describe what is happening to Europe’s population size in terms of birth rates and death. Which country or countries could be experiencing: Emigration (Explain) Immigration (Explain)arrow_forward
- Year (Y) Population Size (N) 1910 30 1920 125 1930 350 1940 1200 1950 Graph the data from the table above into the answer box. Use the information from the graph to complete the following questions. Answer: 1. Considering ONLY the information you were given in the introductory paragraph regarding reindeer reproductive habits and predation, would you predict that the population growth curve would be logistic or exponential? Support your answer. Answer: 2. Describe the growth pattern that existed from 1910 to 1950. Si ɔport y ur answer. Answer: 3. Provide a possible hypothesis explaining the changes in ɔopuli ion be ween 1940 and 1950. Answer: 4. Using the information you have been given about caribou populations, state two factors that have limited the size of the caribou population. For each, indicate vhether it is a density-dependent or density-independent factor. Answer:arrow_forwardPopulation Growth (continued) The graph below shows the population of Peregrine falcons in the United States (excluding Alaska and Hawaii). Look at the graph, then answer the questions below. 1,800 American peregrine falcon 1,600 Lower 48 States 1,400 1,200 1,000 800 600 400 200 1974 1976 1978 1972 1980 1982 1984 What does the growth pattern of the falcon tell you about resources in their habitat? 1986 1988 1990 1994 1996 Center for Biological Diversity The population is overharvesting the resources and will crash soon. 1998 The key resources for population growth are readily available. Nothing, the line represents the population growth and does not indicate anything about the resources available in the environment. There is a limited quantity of resources. Breeding Pairs 1992arrow_forwardInitial Population size: 567 per capita death rate over 3 years: 0.3 " " birth " " " " 0.2 after 3 years; the population has an exponentially per-capita growth rate of 0.87 over 10 years. what is the final population sizearrow_forward
- Which of the following statements is most accurate in regards to the graph shown below? * u m e time This graph compares the stationary phase of growth between two populations living in symbiosis of parasitism. The upper curve represents the host population and the lower curve represents the parasite population. This graph shows the impact of predation within an ecological community. The UPPER curve represents the prey predator population. ulation, and the LOWER curve represents the This graph compares the stationary phase of growth between two populations living in symbiosis of mutualism. This graph shows the impact of predation within an ecological community. The LOWER curve represents the prey population, and the UPPER curve represents the predator population.arrow_forwardUse the information provided: population experiences density-dependent growth K or carrying capacity is 180 r = 0.032 individual/month 1. Calculate how many bugs are added to the population next month when population size is 65? 2. Now keeping the condition of density dependent growth, let's change some numbers: K=270 and r=0.13. If the current population is 125 bugs, how large will the population be in 12 months?arrow_forwardExit e Text: How Populations Grow Figure 5-3 Factors That Affect Population Growth The numbers of individuals that are born, that die, or that enter or leave a population affect the growth of a population. Use Models How would you expand this model to include the effects of fishing on this population? NOTEBOOK A population increases when new individuals are born. A population may decrease in size if individuals move away from it. Births Emigration Population Increases Population Decreases Immigration Fish population Deaths A population may increase in size if individuals arrive from elsewhere. A population decreases when individuals die.arrow_forward
- How would you describe human population growth for the past 200 years. When determining Earth’s carrying capacity for humans, why is it not enough to just consider human numbers? What will happen if there is a rapid growth in human population? What solutions do you have in mind to limit the human population growth?arrow_forwardThis graph plots the difference between birth rates and death rates in Mexico during the 20th century. During which quarter century did Mexico experience the greatest rate of population growth? a) 1900–1925 50 b) 1925–1950 40 c) 1950–1975 Rate of 30 increase d) 1975–2000 20 Birth rate Death rate 10 1900 1925 1950 1975 2000 2025 2050 Year Adapted from Transitions in World Population, Population Bulletin 59: 1 (2004). © 2018 Pearson Education, Inc. Birth or death rate per 1,000 populationarrow_forwardThe world population in 2017 was 7.5 billion, and its annual growth rate was 1.2%. If the birth rate was over 20 per 1,000 people in the year of 2017, what was the death rate, expressed as number per 1,000 people?arrow_forward
arrow_back_ios
SEE MORE QUESTIONS
arrow_forward_ios
Recommended textbooks for you
 Case Studies In Health Information ManagementBiologyISBN:9781337676908Author:SCHNERINGPublisher:Cengage
 Biology (MindTap Course List)BiologyISBN:9781337392938Author:Eldra Solomon, Charles Martin, Diana W. Martin, Linda R. BergPublisher:Cengage Learning
Case Studies In Health Information Management
Biology
ISBN:9781337676908
Author:SCHNERING
Publisher:Cengage
Biology (MindTap Course List)
Biology
ISBN:9781337392938
Author:Eldra Solomon, Charles Martin, Diana W. Martin, Linda R. Berg
Publisher:Cengage Learning
POPULATION REGULATION AND LIMITING FACTORS | DENSITY INDEPENDENT AND DENSITY DEPENDENT FACTORS; Author: BioVidyalaya;https://www.youtube.com/watch?v=mB-AB-5Wnhs;License: Standard YouTube License, CC-BY
Population growth; Author: SiouxScience;https://www.youtube.com/watch?v=XnaC9iOumVA;License: Standard YouTube License, CC-BY