
Case Studies In Health Information Management
3rd Edition
ISBN: 9781337676908
Author: SCHNERING
Publisher: Cengage
expand_more
expand_more
format_list_bulleted
Related questions
Question
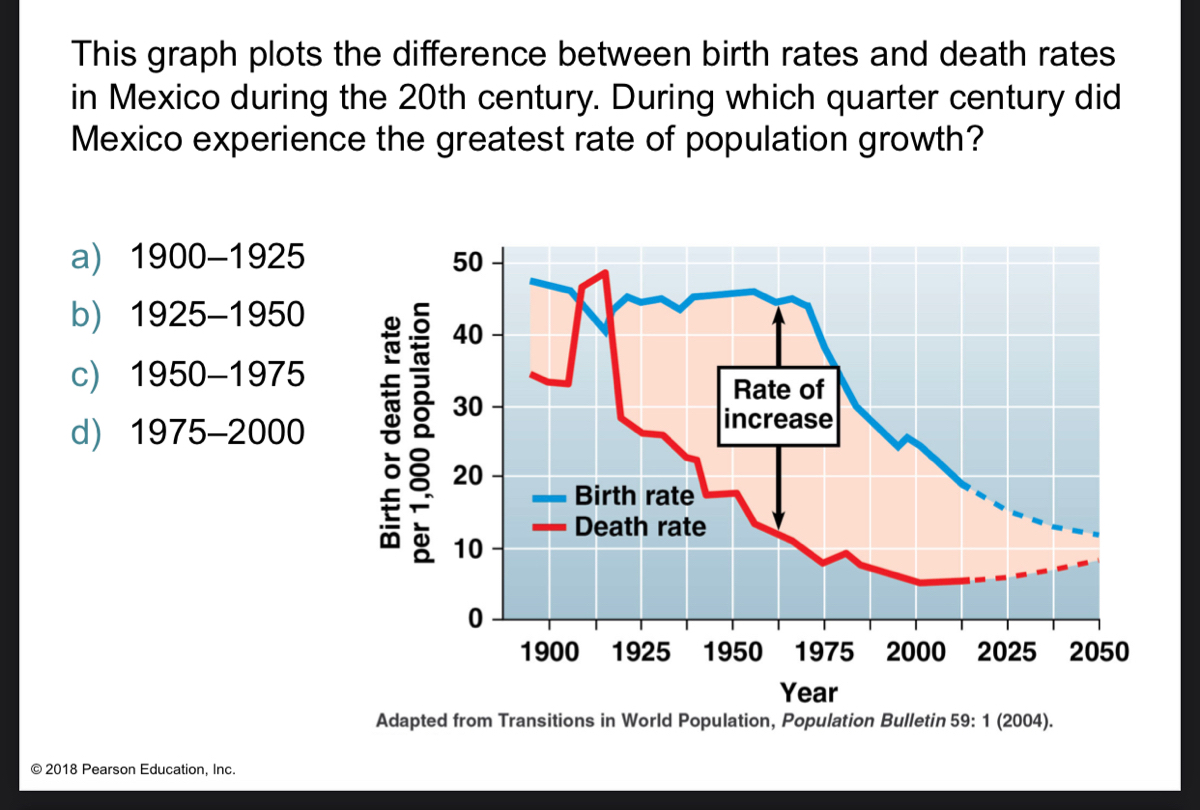

Transcribed Image Text:This graph plots the difference between birth rates and death rates
in Mexico during the 20th century. During which quarter century did
Mexico experience the greatest rate of population growth?
a) 1900–1925
50
b) 1925–1950
40
c) 1950–1975
Rate of
30
increase
d) 1975–2000
20
Birth rate
Death rate
10
1900
1925 1950 1975
2000
2025
2050
Year
Adapted from Transitions in World Population, Population Bulletin 59: 1 (2004).
© 2018 Pearson Education, Inc.
Birth or death rate
per 1,000 population
Expert Solution
This question has been solved!
Explore an expertly crafted, step-by-step solution for a thorough understanding of key concepts.

This is a popular solution

Trending nowThis is a popular solution!

Step by stepSolved in 2 steps

Knowledge Booster


Learn more about
Need a deep-dive on the concept behind this application? Look no further. Learn more about this topic, biology and related others by exploring similar questions and additional content below.Similar questions
- What are the two key concepts for this section? Listthree variables that affect the growth and decline ofhuman populations. How can we calculate the population change of an area? Define the total fertilityrate (TFR). How has the global TFR changed since1955? Summarize the story of population growth inthe United States. List six changes in lifestyles thathave taken place in the United States during the 20thcentury, leading to a rise in per capita resource use.arrow_forwardS2) Below are two tables showing the population size and deaths by age for one year in the states of Louisiana (LA) and Florida (FL). Use the data to answer the following questions. You may use the blank cells in the tables for calculations and to show answers Age group 0-15 16-70 71+ Louisiana Deaths 30 215 585 Florida Age group Deaths 0-15 16-70 71+ 25 400 725 Population 165,000 300,000 75,000 Population 90,000 435,000 225,000 a. Calculate the overall crude mortality rates for LA and FL expressed as per 100,000 population. LA: FL: b. Calculate the age-adjusted mortality rates using the combined population as the standard. c. Explain what accounts for this difference in crude rates and adjusted rates between LA and FL.arrow_forward3 oBook References Classify each of the following descriptions by its effect on human population growth rates. Low death rate compared to birth rate First phase of demographic transition A population close to its carrying capacity Low birth rate Outbreak of deadly infectious diseases High mortality rate Second phase of demographic transition Current conditions in India Low population growth High population growtharrow_forward
- Visit the website of the Population Reference Bureau, www.prb.org (Links to an external site.). Find the most recent “World Population Data Sheet” under the Data section. Choose two nations to compare with respect to: birth rate, death rate, infant mortality rate, rate of population growth, and/or other data indicators of interest to you. What do these data tell you about the health of the populations of these countries?arrow_forwardThe data below represent a cohort of organism “X”, tracked from birth to death. Time period* Number alive at start of period Proportion surviving at start of time interval Deaths during period Rate of mortality during time period "0-1" 432 1.00 390 0.90 "1-2" 42 0.10 29 0.69 "2-3" 13 "3-4" 11 "4-5" 10 "5-6" 9 "6-7" 7 "7-8" 3 "8-9" 0 * Numbers are reported over eight equal sized time periods – these could represent days, weeks, months or years. 1.Complete the table by recording survivorship (proportion alive at the start of the time period), the number of deaths and the mortality rate for each time period. For each column you need to ensure you indicate how you performed your calculation (e.g. show one example calculation or provide a formula). 2.Plot a survivorship curve for species X using semi-log graph paper.Remember that survivorship is, by convention, plotted as a proportion of…arrow_forwardThe life table below is for a species of lizard. Use it to answer the questions below. It can be copied and pasted in excel or downloaded here. What is the intrinsic rate of increase of this population? nx bx 678 1 102 31 3 19 10 4 14 12 5 12 12 6 10 14 7 10 10 8 8 11 9 7 10 1.89 0.053 O 1.32 0.51arrow_forward
- The chart below shows selected population data for twodifferent countries, A and B. Study the chart and answerthe questions that follow Calculate the rates of natural increase (due to birthsand deaths, not counting immigration) for the populations of country A and country B. Based on thesecalculations and the data in the table, for each of thecountries, suggest whether it is a more-developedcountry or a less-developed country and explain thereasons for your answersarrow_forwardVisit the website of the Population Reference Bureau, www.prb.org (Links to an external site.). Find the most recent “World Population Data Sheet” under the Data section. Choose two nations to compare with respect to: birth rate, death rate, infant mortality rate, rate of population growth, and/or other data indicators of interest to you. What do these data tell you about the health of the populations of these countries? Add references you used and an accurate data sheetarrow_forwardOut of the following age groups , which has changed significantly the most over time in the United States? A) ages under 5 years B) ages above 80 years C) ages 25 to 34 years D) ages 35 to 44 yearsarrow_forward
- Review the age structure graphs shown in Figure 5-15. How do patterns in the graphs indicate the rate that a population is increasing or decreasing?arrow_forwardShown is an age pyramid of Brazil in the year 2021. Describe its shape. What does the shape of the age pyramid tell you about their population? What can be said about the birth rates and death rates.arrow_forwardUsing the above graph, what is the approximate percent of the population in the US and Kenya that is under the age of 15? (number order represents US, Kenya) A24,26 B12,28 C32,62 D16,36arrow_forward
arrow_back_ios
SEE MORE QUESTIONS
arrow_forward_ios
Recommended textbooks for you
- Case Studies In Health Information ManagementBiologyISBN:9781337676908Author:SCHNERINGPublisher:Cengage
 Biology 2eBiologyISBN:9781947172517Author:Matthew Douglas, Jung Choi, Mary Ann ClarkPublisher:OpenStax
 Biology (MindTap Course List)BiologyISBN:9781337392938Author:Eldra Solomon, Charles Martin, Diana W. Martin, Linda R. BergPublisher:Cengage Learning
Case Studies In Health Information Management
Biology
ISBN:9781337676908
Author:SCHNERING
Publisher:Cengage
Biology 2e
Biology
ISBN:9781947172517
Author:Matthew Douglas, Jung Choi, Mary Ann Clark
Publisher:OpenStax
Biology (MindTap Course List)
Biology
ISBN:9781337392938
Author:Eldra Solomon, Charles Martin, Diana W. Martin, Linda R. Berg
Publisher:Cengage Learning