
Concept explainers
Videos
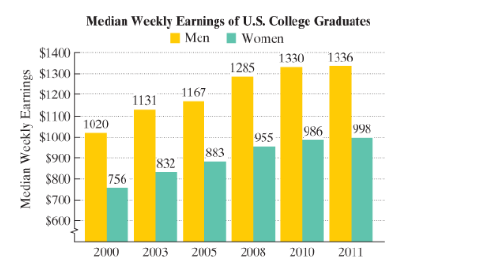
The data can be described by the following mathematical models:
Median weekly earnings of male college graduates = M
Median weekly earning of female college graduates = F
In each mathematical model, n represents the number of years after 2000. Use this information to solve Exercises 99−100.
99.
a. Use the appropriate formula to find the median weekly earnings of male college graduates in 2010. Does this value underestimate or overestimate the earnings shown by the bar graph? By how much?
b. Use the appropriate formula to find the median weekly earnings of female college graduates in 2010 Does this value underestimate or overestimate the earnings shown by the bar graph? By how much?
c. Use the values given by the mathematical models in parts (a) and (b) to find the difference between men’s weekly earnings and women’s weekly earnings in 2010. How does this compare with the difference in earnings shown by the graph?
Want to see the full answer?
Check out a sample textbook solution
Chapter 1 Solutions
EBK INTRODUCTORY ALGEBRA FOR COLLEGE ST


- A bank developed a model for predicting the average checking and savings account balance as balance = - 17,949 + 316 x age + 1,129 x years education + 0.136x household wealth. ents a. Explain how to interpret the numbers in this model. b. Suppose that a customer is 26 years old, is a college graduate (so that years education = 16), and has a household wealth of $190,000. What is the predicted bank balance? Grade anch a. The number 17,949 Contents The number 316 The number 1,129 Plan The number 0.136 p & Resoui ary essible Res rchase Optic ommunicatio Click to select your answer(s) and then click Check Answer. 1 part remaining Clear All Check Answer Type here to search [] F6 & 7arrow_forwardUse excel in this question: The Motion Picture Distributors Association of Australia collects yearly data on gross box office takings of the films in Australia. Data is provided here for the years 1990-2004. (Unfortunately more recent data is not readily available.) Is the highest box office takings for a film related to the number of films screened in Australia that year? Year No. of films screened Highest box office ($ million) 1990 252 26.1 1991 240 19.22 1992 229 18.73 1993 259 31.74 1994 252 24.65 1995 253 17.93 1996 281 29.29 1997 285 22.7 1998 273 47.33 1999 255 38.72 2000 250 30.72 2001 245 32.05 2002 258 33.81 2003 268 37.14 2004 318 50.35 1. Produce a scatterplot of the relevant data. Comment on the appropriateness of analysing this data using a linear regression model. 2. Use the statistics from a regression analysis of this data to evaluate the evidence for a useful predictive linear relationship between the two variables at the 5%…arrow_forwardThe scatterplot shows the relationship between Marvin's age and the time it took him to run a mile. Running Times 10 12 14 16 18 Age (years) Which statement best describes the relationship between Marvin's age and the time it takes him to run a mile? As Marvin's age increased, the time it took him to run a mile increased. As Marvin's age increased, the time it took him to run a mile decreased. As Marvin's age increased, the time it took him to run a mile remains constant. There is no relationship between Marvin's age and the time it took him to run a mile. ttps://ola3.performancematters.com/ola/ola.jsp?clientCode=Dvahenricocounty# P Type here to search Time to Run a Mile (minutes)arrow_forward
- Prices of diamonds are determined by what is known as the 4 Cs: cut, clarity, color, and carat weight. The prices of diamonds go up as the carat weight increases, but the increase is not smooth. For example, the difference between the size of a 0.99-carat diamond and a 1-carat diamond is undetectable to the naked human eye, but the price of a 1-carat diamond tends to be much higher than the price of a 0.99 diamond. In this question, we use two random samples of diamonds, 0.99 carats and 1 carat, each sample of size 23, and compare the average prices of the diamonds. In order to be able to compare equivalent units, we first divide the price for each diamond by 100 times its weight in carats. That is, for a 0.99-carat diamond, we divide the price by 99. For a 1 carat diamond, we divide the price by 100. The distributions and some sample statistics are shown below I have attached the questions and the chart in the images section. Thank youarrow_forwardLet T be the number of years since 1988. What does t = 12 mean in this situation?arrow_forwardYou’ve been wondering about the latest rise in taxi services, such as Uber and Lyft. You wondered if college students have a preference. You ask 67 college students which service they prefer. You find that 28 indicate Uber, while 39 indicate Lyft.The chi-square value is (round to 2 decimals):arrow_forward
- please answer 8d, e, and f.arrow_forwardACT scores overall have a mean of 1017 and s = 207. If a college wants to admit only the top 30% of those, what score would they use as the minimum required? (Round to the appropriate whole number score). They would admit scores of and above.arrow_forwardA doctor works at a hospital estimate when to leave for work from his apartment; he decided to measure how long it takes him to go to the hospital every day. For one week, he records the time it gets him to drive from his apartment to the hospital, including searching for parking and reaching to his office. The data are as follows: M Eighty-one Min T Fifty-four Min W Seventy Min R Fifty-two Min F Forty-three Min 1- Will you recognize these times as a sample or a population? and way 2- Obtain the mean and the standard deviation for the time it requires him to go to his office at the hospital. 3- Lets say his roommate, who is working with him at the same hospital and same office, takes the train to the hospital. She records the time it takes her to get to the office during the exact week and was that her mean was Sixty-two minutes, and the standard deviation was Five. Based on these measurements, it is convenient to drive or ride the…arrow_forward
- Using excel, guess the temperature of the earth in 2050 from the data below Year temperature (°C) 1880 -0.161881…arrow_forwardAnswer question 3. stepwise.arrow_forwardCollege students are graduating with the highest debt burden in history. The bar graph shows the mean, or average, student-loan debt in the United States for five selected graduating years from 2001 through 2013. Here are two mathematical models for the data shown by the graph. In each formula, D represents mean student-loan debt, in dollars, x years after 2000. The Model 1 is, D = 1188x + 16,218 and the Model 2 is D = 46x2 + 541x + 17,650. Solve, a. Which model better describes the data for 2001?b. Does the polynomial model of degree 2 underestimate or overestimate the mean student-loan debt for 2013? By how much?arrow_forward
 Algebra & Trigonometry with Analytic GeometryAlgebraISBN:9781133382119Author:SwokowskiPublisher:Cengage
 Holt Mcdougal Larson Pre-algebra: Student Edition...AlgebraISBN:9780547587776Author:HOLT MCDOUGALPublisher:HOLT MCDOUGAL
 Trigonometry (MindTap Course List)TrigonometryISBN:9781337278461Author:Ron LarsonPublisher:Cengage Learning
 Glencoe Algebra 1, Student Edition, 9780079039897...AlgebraISBN:9780079039897Author:CarterPublisher:McGraw Hill