
Videos
The bar graph shows that in 2001, the U.S. government collected more in taxes than it spent, so there was a budget surplus for that year. By contrast, in 2003 through 2013, the government spent more than it collected, resulting in budget deficits. Exercises 79−80 involve these deficits.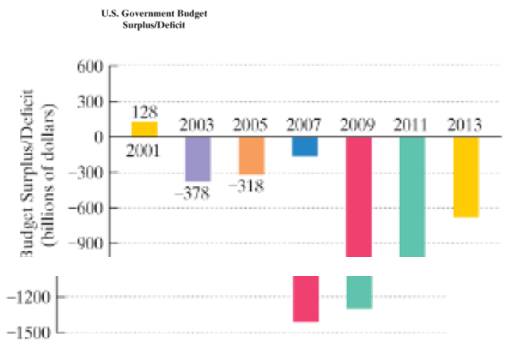
80.
In 2007, the government collected $2568 billion and spent $2729 billion. Find
b. In 2009, the government collected $2105 billion and spent $351 8 billion. Find the deficit,in billions of dollars, for 2009.
c. Use your answers from parts (a) and (b) to determine the combined deficit, in billions of dollars for 2007 and 2009.
Want to see the full answer?
Check out a sample textbook solution
Chapter 1 Solutions
EBK INTRODUCTORY ALGEBRA FOR COLLEGE ST


- Four-fifths of the people on a hike are children. If there are 12 children, what is the total number of people on the hike?arrow_forwardIn 1990, the population of a country doubles compared to that of 1970. In what year will the population treble?arrow_forwardBatman, Robin, and Alfred all have $100,000 in a chest. Batman's pile increases by $2,550. Robins stack decreases by $5,000. and Alfred's money increases by $4,550. Who's chest of money changed the most?arrow_forward
- A farmer plants 9000 acres of wheat one year. Each year thereafter, he harvests (removes) 10 of the planted acreage and then plants 500 more acres. The number of acres of wheat planted approaches what number over many, many years? Previewarrow_forwardA school fund raising event sold a total of 182 tickets and generated a total revenue of $612.15. There are two types of tickets: adult tickets and child tickets. Each adult ticket costs $5.25, and each child ticket costs $2.10. adult tickets= child tickets =arrow_forwardYou work for a social media company. In 2016 your platform had 1.5 million users. In 2019 your platform had 7.5 million users. On average, by how much did your company’s number of users increase from 2016 to 2019?arrow_forward
- In 2010, there were 13,300 students at college A, with a projected enrollment increase of 1000 students per year. In the same year, there were 26,800 students at college B, with a projected enrollment decline of 500 students per year. Solve, According to these projections, when will the colleges have the same enrollment? What will be the enrollment in each college at that time?arrow_forwardAnswer the table only, Asaparrow_forward
 Glencoe Algebra 1, Student Edition, 9780079039897...AlgebraISBN:9780079039897Author:CarterPublisher:McGraw Hill
 Holt Mcdougal Larson Pre-algebra: Student Edition...AlgebraISBN:9780547587776Author:HOLT MCDOUGALPublisher:HOLT MCDOUGAL
 Algebra: Structure And Method, Book 1AlgebraISBN:9780395977224Author:Richard G. Brown, Mary P. Dolciani, Robert H. Sorgenfrey, William L. ColePublisher:McDougal Littell
 Algebra for College StudentsAlgebraISBN:9781285195780Author:Jerome E. Kaufmann, Karen L. SchwittersPublisher:Cengage Learning
 Intermediate AlgebraAlgebraISBN:9781285195728Author:Jerome E. Kaufmann, Karen L. SchwittersPublisher:Cengage Learning
 Elementary AlgebraAlgebraISBN:9780998625713Author:Lynn Marecek, MaryAnne Anthony-SmithPublisher:OpenStax - Rice University