In a series of experiment, block B is to be placed in a thermally insulated container with block A , which has the same mass as block B. In each experiment, block B is initially at a certain temperature T B , but temperature T A of block A is changed front experiment to experiment. Let T f represent the final temperature of the two blocks when they reach thermal equilibrium in any of the experiments. Figure 18-53 gives temperature T f versus the initial temperature T A for a range of possible values of T A , from T A 1 = 0 K to T A 2 = 500 K. The vertical axis scale is set by T fs = 400 K. What are (a) temperature T B and (b) the ratio c B / c A of the specific heats of the blocks? Figure 18-53 Problem 74.
In a series of experiment, block B is to be placed in a thermally insulated container with block A , which has the same mass as block B. In each experiment, block B is initially at a certain temperature T B , but temperature T A of block A is changed front experiment to experiment. Let T f represent the final temperature of the two blocks when they reach thermal equilibrium in any of the experiments. Figure 18-53 gives temperature T f versus the initial temperature T A for a range of possible values of T A , from T A 1 = 0 K to T A 2 = 500 K. The vertical axis scale is set by T fs = 400 K. What are (a) temperature T B and (b) the ratio c B / c A of the specific heats of the blocks? Figure 18-53 Problem 74.
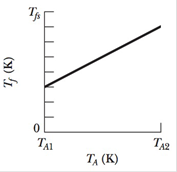
In a series of experiment, block B is to be placed in a thermally insulated container with block A, which has the same mass as block B. In each experiment, block B is initially at a certain temperature TB, but temperature TA of block A is changed front experiment to experiment. Let Tf represent the final temperature of the two blocks when they reach thermal equilibrium in any of the experiments. Figure 18-53 gives temperature Tf versus the initial temperature TA for a range of possible values of TA, from TA1 = 0 K to TA2= 500 K. The vertical axis scale is set by Tfs = 400 K. What are (a) temperature TB and (b) the ratio cB/cA of the specific heats of the blocks?
A hot object is dropped into a thermally insulated container of water, and the object and water are then allowed to come to thermal equilibrium. The experiment is repeated twice, with different hot objects. All three objects have the same mass and initial temperature, and the mass and initial temperature of the water are the same in the three experiments. For each of the experiments, Fig. 18-29 gives graphs of the temperatures T of the object and the water versus time t. Rank the graphs according to the specific heats of the objects, greatest first.
A copper bar is welded end to end to a bar of an unknown metal. The two bars have the same lengths and cross-sectional areas. The free end of the copper bar is maintained at a temperature TH that can be varied. The free end of the unknown metal is kept at 0.0∘C. To measure the thermal conductivity of the unknown metal, you measure the temperature T at the junction between the two bars for several values of TH. You plot your data as T versus TH both in kelvins, and find that your data are well fit by a straight line that has slope 0.460.
What do your measurements give for the value of the thermal conductivity of the unknown metal? Use kCu = 385 W/(m⋅K) .
Essential University Physics: Volume 2 (3rd Edition)
Knowledge Booster
Learn more about
Need a deep-dive on the concept behind this application? Look no further. Learn more about this topic, physics and related others by exploring similar questions and additional content below.


 Physics for Scientists and Engineers: Foundations...PhysicsISBN:9781133939146Author:Katz, Debora M.Publisher:Cengage Learning