
Videos
Comparative ratio analysis
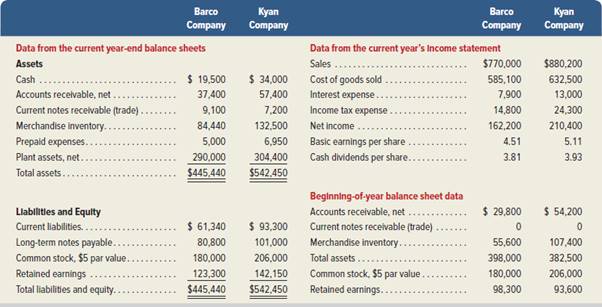
Summary information from the financial statements of two companies competing in the same industry follows.
Required
- 1. For both companies compute the (a)
current ratio , (b) acid-test ratio, (c) accounts (including notes) receivable turnover, (d) inventory turnover, (e) days’ sales in inventory, and (f) days’ sales uncollected. Identify the company you consider to be the better short-term credit risk and explain why. Round to one decimal place.
Check (1) Kyan: Accounts receivable turnover, 14.8; Inventory turnover, 5.3
- 2. For both companies compute the (a) profit margin ratio, (b) total asset turnover, (c) return on total assets, and (d) return on common stockholders’ equity. Assuming that each company’s stock can be purchased at $75 per share, compute their (e) price-earnings ratios and ( f) dividend yields. Round to one decimal place. Identify which company’s stock you would recommend as the better investment and explain why.
(2) Barco: Profit margin, 21.1%; PE, 16.6
1.
Compute the (a) current ratio, (b) acid-test ratio, (c) accounts (including notes) receivable turnover, (d) inventory turnover, (e) days’ sales in inventory, and (f) days’ sales uncollected of Company F and Company B and identify the company that would the better on terms of short-term credit risk and explain the reasons.
Explanation of Solution
- a) Current ratio: Current ratio is one of the liquidity ratios, which measures the capacity of the company to meet its short-term obligations using its current assets. Current ratio is calculated by using the formula:
- b) Acid-test ratio: It is a ratio used to determine a company’s ability to pay back its current liabilities by liquid assets that are current assets except inventory and prepaid expenses.
- c) Accounts receivables turnover ratio: Receivables turnover ratio is mainly used to evaluate the collection process efficiency. It helps the company to know the number of times the accounts receivable is collected in a particular time period. This ratio is determined by dividing credit sales and average net receivables.
- d) Inventory Turnover Ratio: This ratio is a financial metric used by a company to quantify the number of times inventory is used or sold during the accounting period. It is calculated by using the formula:
- e) Days’ sales in inventory: Days’ in inventory is determined as the number of days a particular company takes to make sales of the inventory available with them.
- f) Days’ sales uncollected: This ratio is used to determine the number of days a particular company takes to collect accounts receivables.
Compute ratios of Company B and Company K:
| Ratios | Company B | Company K | |
| (a) Current ratio | |||
| Cash | $19,500 | $34,000 | |
| Accounts receivables, net | $37,400 | $57,400 | |
| Current notes receivable (trade) | $9,100 | $7,200 | |
| Merchandise inventory | $84,440 | $132,500 | |
| Prepaid expenses | $5,000 | $6,950 | |
| Current assets (A) | $155,440 | $238,050 | |
| Current liabilities (B) | $61,340 | $93,300 | |
| Current ratio | 2.5:1 | 2.6:1 | |
| (b) Acid-test ratio | |||
| Cash | $19,500 | $34,000 | |
| Accounts receivables, net | $37,400 | $57,400 | |
| Current notes receivable (trade) | $9,100 | $7,200 | |
| Quick assets (C) | $66,000 | $98,600 | |
| Current liabilities (D) | $61,340 | $93,300 | |
| Acid-test ratio | 1.1:1 | 1.1:1 | |
| (c) Accounts (including notes) receivables turnover ratio | |||
| Accounts receivables, net (E) | $29,800 | $54,200 | |
| Current notes receivable (trade) (F) | $0 | $0 | |
| Total beginning net accounts (including notes) receivables (G) | $29,800 | $54,200 | |
| Accounts receivables, net (H) | $37,400 | $57,400 | |
| Current notes receivable (trade) (I) | $9,100 | $7,200 | |
| Total ending net accounts (including notes) receivables (J) | $46,500 | $64,600 | |
| Average net accounts (including notes) receivables (K) | $38,150 | $59,400 | |
| Net credit sales (L) | $770,000 | $880,200 | |
| Accounts (including notes) receivables turnover ratio | 20.2 times | 14.8 times | |
| (d) Inventory turnover ratio | |||
| Ending inventory (M) | $84,440 | $132,500 | |
| Beginning inventory (N) | $55,600 | $107,400 | |
| Average inventory (O) | $70,020 | $119,950 | |
| Cost of goods sold (P) | $585,100 | $632,500 | |
| Inventory turnover ratio | 8.4 times | 5.3 times | |
| (e) Days’ sales in inventory | |||
| Ending inventory (Q) | $84,440 | $132,500 | |
| Cost of goods sold (R) | $585,100 | $632,500 | |
| Days’ sales in inventory | 52.7 days | 76.5 days | |
| (f) Days’ sales uncollected | |||
| Ending Accounts receivables, net (S) | $37,400 | $57,400 | |
| Ending Current notes receivable (trade) (T) | $9,100 | $7,200 | |
| Total ending net accounts (including notes) receivables (U) | $46,500 | $64,600 | |
| Net credit sales (V) | $770,000 | $880,200 | |
| Days’ sales uncollected | 22.0 days | 26.8 days | |
Table (1)
Short term credit risk analysis: As per Table (1) the current ratio of Company K is slightly better than the current ratio of Company B. The acid-test ratios of both the companies are same. The accounts turnover and the inventory turnover of Company B are better than the ratios of Company F. However, the day’s sales in inventory and the day’s sales uncollected of Company F are 76.5 days and 26.8 days respectively, that are higher than the ratios of Company B. Hence, Company B is better in managing the short term credit risk.
2.
Compute the (a) profit margin ratio, (b) total asset turnover, (c) return on total assets, (d) return on common stockholders’ equity, (e) price earnings ratio, and (f) dividend yields of Company F and Company B and identify the company that could be recommended as better investment and explain the reasons.
Explanation of Solution
- a) Profit margin: It is one of the profitability ratios. Profit margin ratio is used to measure the percentage of net income that is being generated per dollar of revenue or sales.
- b) Total asset turnover: Total asset turnover is a ratio that measures the productive capacity of the total assets to generate the sales revenue for the company. Thus, it shows the relationship between the net sales and the average total assets. Turnover of assets is calculated as follows:
- c) Return on total assets: Return on total assets is the financial ratio that determines the amount of net income earned by the business with the use of total assets owned by it. It indicates the magnitude of the company’s earnings with relative to its total assets. Return on investment is calculated as follows:
- d) Return on common stockholders’ equity ratio: It is a profitability ratio that measures the profit generating ability of the company from the invested money of the shareholders. The formula to calculate the return on equity is as follows:
- e) Price/Earnings Ratio: The price/earnings ratio shows the market value of the amount invested to earn $1 by a company. It is major tool used by investors for making decisions related to the investment in a company.
- f) Dividend yields: Dividend yield ratio indicates how much percentage of share prices a company pays out in the form of dividends price. The formula to calculate the dividend yield percentage is as follows:
Compute ratios of Company B and Company K:
| Ratios and Formula | Company B | Company K |
|
a. Profit margin: | ||
|
b. Total asset turnover: | ||
|
c. Return on total assets: | ||
|
d. Return on common stockholders’ equity: | ||
|
e. Price-earnings ratio: | ||
|
f. Dividend yield: |
Table (2)
Investment analysis: As per Table (2) the profitability ratios of Company K is higher than the ratios of Company B. However, the price earnings ratio of Company B is higher than Company K, but the dividend yield of Company K is higher than Company B. Hence, Company K is a better investment option.
Working Note:
Determine the average total assets and average common stockholders’ equity.
| Ratios and Formula | Company B | Company K |
|
a. Average total assets: | ||
|
b. Average common stockholders’ equity: |
Table (3)
Want to see more full solutions like this?
Chapter 17 Solutions
Principles of Financial Accounting.


- Review the select information for Bean Superstore and Legumes Plus (industry competitors), and then complete the following. A. Compute the accounts receivable turnover ratios for each company for 2018 and 2019. B. Compute the number of days sales in receivables ratios for each company for 2018 and 2019. C. Determine which company is the better investment and why. Round answers to two decimal places.arrow_forwardRatios Analyses: McCormick Refer to the information for McCormick above. Additional information for 20X3 it as follows (amounts in millions): Required: Next Level Compute the following for 20X3. Provide a brief description of what each ratio reveals about McCormick 1. return on common equity 2. debt-to-assets 3. debt-toequity 4. current 5. quick (McCormick uses cash and equivalents, short-term securities and receivables in their quick ratio calculation.) 6. inventory turnover days 7. accounts receivable turnover days 8. accounts payable turnover days 9. operating cycle (in days) 10. total asset turnover Use the following information for 14-17 and 14-18: The Hershey Company is one of the worlds leading producers of chocolates, candies, and confections. It sells chocolates and candies, mints and gums, baking ingredients, toppings, and beverages. Hersheys consolidated balance sheets for 20X2 and 20X3 follow.arrow_forwardMeasures of liquidity, solvency, and profitability The comparative financial statements of Marshall Inc. are as follows. The market price of Marshall common stock was 82.60 on December 31, 20Y2. Instructions Determine the following measures for 20Y2, rounding to one decimal place, including percentages, except for per-share amounts: 1. Working capital 2. Current ratio 3. Quick ratio 4. Accounts receivable turnover 5. Number of days sales in receivables 6. Inventory turnover 7. Number of days sales in inventory 8. Ratio of fixed assets to long-term liabilities 9. Ratio of liabilities to stockholders equity 10. Times interest earned 11. Asset turnover 12. Return on total assets 13. Return on stockholders equity 14. Return on common stockholders equity 15. Earnings per share on common stock 16. Price-earnings ratio 17. Dividends per share of common stock 18. Dividend yieldarrow_forward
- Grammatico Company has just completed its third year of operations. The income statement is as follows: Selected information from the balance sheet is as follows: Required: Note: Round answers to two decimal places. 1. Compute the times-interest-earned ratio. 2. Compute the debt ratio. 3. CONCEPTUAL CONNECTION Assume that the lower quartile, median, and upper quartile values for debt and times-interest-earned ratios in Grammaticos industry are as follows: How does Grammatico compare with the industrial norms? Does it have too much debt?arrow_forwardMeasures of liquidity, solvency, and profitability The comparative financial statements of Marshall Inc. are as follows. The market price of Marshall common stock was 82.60 on December 31, 20Y2. Instructions Determine the following measures for 20Y2 (round to one decimal place, including percentages, except for per-share amounts): 1. Working capital 2. Current ratio 3. Quick ratio 4. Accounts receivable turnover 5. Number of days sales in receivables 6. Inventory turnover 7. Number of days sales in inventory 8. Ratio of fixed assets to long-term liabilities 9. Ratio of liabilities to stockholders equity 10. Times interest earned 11. Asset turnover 12. Return on total assets 13. Return on stockholders equity 14. Return on common stockholders equity 15. Earnings per share on common stock 16. Price-earnings ratio 17. Dividends per share of common stock 18. Dividend yieldarrow_forwardDefine each of the following terms: Liquidity ratios: current ratio; quick, or acid test, ratio Asset management ratios: inventory turnover ratio; days sales outstanding (DSO); fixed assets turnover ratio; total assets turnover ratio Financial leverage ratios: debt ratio; times-interest-earned (TIE) ratio; EBITDA coverage ratio Profitability ratios: profit margin on sales; basic earning power (BEP) ratio; return on total assets (ROA); return on common equity (ROE) Market value ratios: price/earnings (P/E) ratio; price/cash flow ratio; market/book (M/B) ratio; book value per share Trend analysis; comparative ratio analysis; benchmarking DuPont equation; window dressing; seasonal effects on ratiosarrow_forward
- Analyze and compare Bank of America and Wells Fargo Bank of America Corporation (BAC) and Wells Fargo Company (WFC) are two large financial services companies. The following data (in millions) were taken from a recent years financial statements for both companies: a. Compute the earnings per share for both companies. Round to the nearest cent. a. Which company appears to be more profitable on an earnings-per-share basis? b. Which company would you expect to have the larger quoted market price?arrow_forwardThe average liabilities, average stockholders' equity, and average total assets are as follows: 1. Determine the following ratios for both companies, rounding ratios and percentagesto one decimal place: a. Return on total assets b. Return on stockholders' equity c. Times interest earned d. Ratio of total liabilities to stockholders' equity 2. Based on the information in (1), analyze and compare the two companies'solvency and profitability. Comprehensive profitability and solvency analysis Marriott International, Inc., and Hyatt Hotels Corporation are two major owners and managers of lodging and resort properties in the United States. Abstracted income statement information for the two companies is as follows for a recent year (in millions): Balance sheet information is as follows:arrow_forwardComparative Analysis: Under Armour, Inc., versus Columbia Sportswear Refer to the 10-K reports of Under Armour, Inc., and Columbia Sportswear that are available for download from the companion website at CengageBrain.com. Required: Compare the values and trends of these ratios when evaluating Under Armours and Columbias short-term liquidity.arrow_forward
- A Comparing Financial Ratios Presented below are selected ratios the four firms, Badgley is a heavy equipment manu1icturer. Reagan is a newspaper publisher. Klein is a food manufacturer, and Taylor is a grocery chain. Required: 1. Which firm has the weakest current ratio? 2. CONCEPTUAL CONNECTION Explain why the turnover ratios vary so much among the four firms. 3. CONCEPTUAL CONNECTION Explain why the return on equity ratio is larger than the return on asset ratio for all four firms. 4. CONCEPTUAL CONNECTION Discuss whether the large differences in the return on equity ratios can exist over long periods of time.arrow_forwardFINANCIAL RATIOS Based on the financial statements for Jackson Enterprises (income statement, statement of owners equity, and balance sheet) shown on pages 596597, prepare the following financial ratios. All sales are credit sales. The Accounts Receivable balance on January 1, 20--, was 21,600. 1. Working capital 2. Current ratio 3. Quick ratio 4. Return on owners equity 5. Accounts receivable turnover and average number of days required to collect receivables 6. Inventory turnover and average number of days required to sell inventoryarrow_forward
 Cornerstones of Financial AccountingAccountingISBN:9781337690881Author:Jay Rich, Jeff JonesPublisher:Cengage Learning
 Managerial AccountingAccountingISBN:9781337912020Author:Carl Warren, Ph.d. Cma William B. TaylerPublisher:South-Western College Pub
 Intermediate Accounting: Reporting And AnalysisAccountingISBN:9781337788281Author:James M. Wahlen, Jefferson P. Jones, Donald PagachPublisher:Cengage Learning
 College Accounting, Chapters 1-27 (New in Account...AccountingISBN:9781305666160Author:James A. Heintz, Robert W. ParryPublisher:Cengage Learning
 Financial Accounting: The Impact on Decision Make...AccountingISBN:9781305654174Author:Gary A. Porter, Curtis L. NortonPublisher:Cengage Learning
 Financial AccountingAccountingISBN:9781337272124Author:Carl Warren, James M. Reeve, Jonathan DuchacPublisher:Cengage Learning