
Principles of Financial Accounting.
24th Edition
ISBN: 9781260158601
Author: Wild
Publisher: MCG
expand_more
expand_more
format_list_bulleted
Videos
Textbook Question
Chapter 17, Problem 2AP
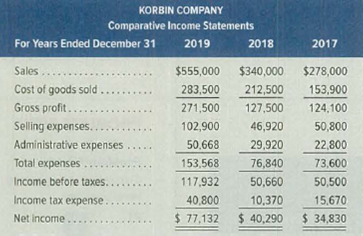
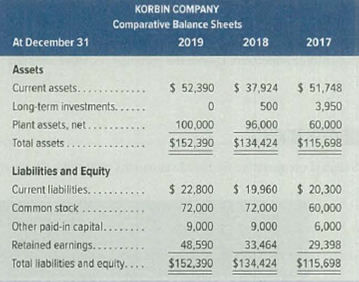
Selected comparative financial statements of Korbin Company follow.
Required
- 1. Compute each year’s
current ratio . Round ratios to one decimal. - 2. Express the income statement data in common-size percents. Round percents to two decimals.
- 3. Express the
balance sheet data in trend percents with 2017 as base year. Round percents to two decimals.
Analysis Component
- 4. Refer to the results from parts 1, 2, and 3. (a) Did cost of goods sold make up a greater portion of sales for the most recent year? (b) Did income as a percent of sales improve in the most recent year? (c) Did plant assets grow over this period?
Expert Solution & Answer
Want to see the full answer?
Check out a sample textbook solution
Students have asked these similar questions
Using the following selected items from the comparative balance sheet of Oriole Products.Determine the horizontal analysis. (Round percentages to 2 decimal places, e.g. 12.21%. Enter negative amounts using either a negative sign preceding the number e.g. -45 or parentheses e.g. (45).)
ORIOLEPRODUCTSComparative Balance SheetDecember 31
2014
2013
Horizontal analysis
Amount
Percentage
Amount
Percentage
Current assets
$110,880
enter percentages
%
$128,216
enter percentages
%
Long-term assets
174,240
enter percentages
%
117,304
enter percentages
%
Total assets
3,168,000
enter percentages
%
2,728,000
enter percentages
%
Determine the vertical analysis. (Round percentages to 1 decimal place, e.g. 12.2%.)
ORIOLEPRODUCTSComparative Balance SheetDecember 31
2014
2013
Vertical analysis
Amount
Percentage
Amount
Percentage
Current assets
$110,880…
1. Compute the following ratios for the comparative periods (2018 and 2019). The company used 365 days in its computation for some of the ratios. Show your solution.
d. Accounts Receivable Turnover Ratio
e. Average Collection Period
f. Inventory Turnover Ratio
g. Average Days in Inventory
h. Number of days in Operating Cycle
i. Debt to Total Assets Ratio
j. Debt to Equity Ratio
k. Times Interest Earned Ratio
l. Gross Profit Ratio
m. Profit Margin Ratio
n. Return on Assets
o. Return on Equity
p. Assets Turnover Ratio
Solve and perform the different financial ratios using the financial statements of XYZ Company for the year 2021.
1. Current Ratio
2. Quick Ratio
3. Receivables Turnover
4. Inventory Turnover
5. Debt Ratio
6. Equity Ratio
7. Times Interest Earned
8. Gross Profit Margin
9. Operating Profit Margin
10. Net Profit Margin
Chapter 17 Solutions
Principles of Financial Accounting.
Ch. 17 - A companys sales in the prior year were 300,000...Ch. 17 - Prob. 2MCQCh. 17 - What is Ella Companys acid-test ratio? a. 2.39 b....Ch. 17 - Prob. 4MCQCh. 17 - What is Ella Companys equity ratio? a. 25.78% b....Ch. 17 - Explain the difference between financial reporting...Ch. 17 - Prob. 2DQCh. 17 - Prob. 3DQCh. 17 - Prob. 4DQCh. 17 - Prob. 5DQ
Ch. 17 - Why is working capital given special attention in...Ch. 17 - What does the number of days sales uncollected...Ch. 17 - Prob. 8DQCh. 17 - Prob. 9DQCh. 17 - Prob. 10DQCh. 17 - Prob. 11DQCh. 17 - Prob. 12DQCh. 17 - Prob. 13DQCh. 17 - Refer to Apples financial statements in Appendix...Ch. 17 - Prob. 15DQCh. 17 - Prob. 16DQCh. 17 - Use Samsungs financial statements in Appendix A to...Ch. 17 - Prob. 1QSCh. 17 - Identify which standard of comparison, (a)...Ch. 17 - Prob. 3QSCh. 17 - Prob. 4QSCh. 17 - Prob. 5QSCh. 17 - Prob. 6QSCh. 17 - Mifflin Co. reported the following for the current...Ch. 17 - Prob. 8QSCh. 17 - Prob. 9QSCh. 17 - Prob. 10QSCh. 17 - Prob. 11QSCh. 17 - Prob. 12QSCh. 17 - Prob. 13QSCh. 17 - Prob. 14QSCh. 17 - Which of the following gains or losses would...Ch. 17 - Building blocks of analysis Match the ratio to the...Ch. 17 - Prob. 2ECh. 17 - Prob. 3ECh. 17 - Prob. 4ECh. 17 - Prob. 5ECh. 17 - Prob. 6ECh. 17 - Refer to Simon Companys balance sheets in Exercise...Ch. 17 - Prob. 8ECh. 17 - Prob. 9ECh. 17 - Prob. 10ECh. 17 - Prob. 11ECh. 17 - Prob. 12ECh. 17 - Prob. 13ECh. 17 - Prob. 14ECh. 17 - Prob. 15ECh. 17 - Prob. 16ECh. 17 - In the current year, Randa Merchandising, Inc.,...Ch. 17 - Use the financial data for Randa Merchandising,...Ch. 17 - Selected comparative financial statements of...Ch. 17 - Selected comparative financial statements of...Ch. 17 - Prob. 3APCh. 17 - Selected current year-end financial statements of...Ch. 17 - Comparative ratio analysis Summary information...Ch. 17 - Selected account balances from the adjusted trial...Ch. 17 - Prob. 1BPCh. 17 - Prob. 2BPCh. 17 - Prob. 3BPCh. 17 - Prob. 4BPCh. 17 - Summary information from the financial statements...Ch. 17 - Prob. 6BPCh. 17 - Prob. 17SPCh. 17 - Use Apples financial statements in Appendix A to...Ch. 17 - Prob. 2AACh. 17 - Prob. 3AACh. 17 - Prob. 1BTNCh. 17 - Prob. 3BTNCh. 17 - Prob. 5BTN
Knowledge Booster


Learn more about
Need a deep-dive on the concept behind this application? Look no further. Learn more about this topic, accounting and related others by exploring similar questions and additional content below.Similar questions
- Juroe Company provided the following income statement for last year: Juroes balance sheet as of December 31 last year showed total liabilities of 10,250,000, total equity of 6,150,000, and total assets of 16,400,000. Required: 1. Calculate the return on sales. (Note: Round the percent to two decimal places.) 2. CONCEPTUAL CONNECTION Briefly explain the meaning of the return on sales ratio, and comment on whether Juroes return on sales ratio appears appropriate.arrow_forward= The current year financial statements for Blue Water Company and Prime Fish Company are presented below. Prime Fish Balance sheet Cash Accounts receivable (net) Inventory Property & equipment (net) Other assets Total assets Current liabilities Long-term debt (interest rate: 15%) Capital stock ($10 par value) Additional paid-in capital Retained earnings Total liabilities and stockholders' equity Income statement Sales revenue (1/2 on credit) Cost of goods sold Operating expenses Net income Other data Per share stock price at end of current year Blue Water $ 42,300 44,500 92,500 159,500 85,300 $ 424,100 $ 92,500 74,100 157,100 30,300 70,100 $ 424,100 $ 427,500 (234,500) (163,600) $ 29,400 $ 23.3 45% $ 19,700 34,900 47,800 416,600 318,000 $ 34,300 $ 837,000 $ 68,500 62,600 525,000 107,300 73,600 $ 837,000 $ 789,000 (401,300) (312,300) $ 75,400 $28 45% Average income tax rate Dividends declared and paid in current year Both companies are in the fish catching and manufacturing business.…arrow_forward2. Complete the below table to calculate income statement data in common-size percents. (Round your percentage answers to 2 decimal places.) KORBIN COMPANY Common-Size Comparative Income Statements For Years Ended December 31, 2019, 2018, and 2017 2019 2018 2017 Sales % % % Cost of goods sold -1 -1 -1 Gross profit Selling expenses -1 -1 -1 Administrative expenses -1 -1 -1 Total expenses Income before taxes -1 -1 -1 Income tax expense -1 -1 -1 Net income % % % See picturearrow_forward
- Alex is currently considering to invest his money in one of the companies betweenCompany A and Company B. The summarized final accounts of the companies for theirlast completed financial year are as follows: (refer to the images) Required:a. Calculate the following ratios for Company A and Company B. State clearly theformulae used for each ratio:i. Gross Profit Marginii. Net Profit Marginiii. Inventory Turnover Period (days)iv. Receivables Collection Period (days)v. Payables Payment Period (days)vi. Current Ratiovii. Quick Ratiob. Comment on each of the ratios calculated in part (a) above.arrow_forwardRequired 1. Compute each year’s current ratio. Round ratios to one decimal. 2. Express the income statement data in common-size percents. Round percents to two decimals. 3. Express the balance sheet data in trend percents with 2017 as the base year. Round percents to two decimals. Analysis Component 4. Comment on any significant relations revealed by the ratios and percents computed.arrow_forwardUse this data to compute the following ratios: 1.Current ratio (Dec 2020 )2.Acid-test Ratio (Dec 2020) 3.Accounts Receivable Turnover 4.Inventory Turnover 5.Return on Assets 6.Profit Margin on Sales 7.Return on Equity 8.Times Interest Earned b.Discuss the financial condition of ABC Company, Inc. based on what you learn from computing the ratios.arrow_forward
- 1. Compute the following ratios for the comparative periods (2018 and 2019). The company used 365 days in its computation for some of the ratios. Show your solution. a. Working Capital b. Current Ratio c. Acid Test Ratio d. Accounts Receivable Turnover Ratio e. Average Collection Period f. Inventory Turnover Ratio g. Average Days in Inventory h. Number of days in Operating Cycle i. Debt to Total Assets Ratio j. Debt to Equity Ratio k. Times Interest Earned Ratio l. Gross Profit Ratio m. Profit Margin Ratio n. Return on Assets o. Return on Equity p. Assets Turnover Ratioarrow_forwardInstructions Using the financial statements and additional information, compute the following ratios for the El Camino Company for 2021. Show all computations. Computations 1. Current ratio 2. Return on common stockholders' equity 3. Price-earnings ratio 4. Inventory turnover 5. Accounts receivable turnover 6. Times interest earned 7. Profit margin 8. Days in inventory 9. Payout ratio 10. Return on assetsarrow_forwardNot Graded Using the fiscal year end 2020 annual report for General Mills, Inc. and the figures from the 2020 annual report as noted below, calculate the financial ratios for 2020 and 2019 indicated using the EXCEL template provided:1. Gross profit percentage2. Return on sales3. Asset turnover 4. Return on assets5. Return on common stockholders’ equity6. Current ratio7. Quick ratio8. Operating-cash-flow-to-current-liabilities ratio9. Accounts receivable turnoverTotal assets 2020 = $30,806.7Total stockholders’ equity 2020 = $8,349.5Total current liabilities 2020 = $7,491.5Accounts receivable 2020 = $1,615.1Inventory 2020 = $1,426.3Year-end closing stock price May 2020 = $58.80Year-end closing stock price May 2019 = $53.56arrow_forward
- Using the fiscal year end 2020 annual report for General Mills, Inc. and the figures from the 2020 annual report as noted below, calculate the financial ratios for 2020 and 2019 indicated using the EXCEL template provided:1. Gross profit percentage2. Return on sales3. Asset turnover 4. Return on assets5. Return on common stockholders’ equity6. Current ratio7. Quick ratio8. Operating-cash-flow-to-current-liabilities ratio9. Accounts receivable turnoverTotal assets 2020 = $30,806.7Total stockholders’ equity 2020 = $8,349.5Total current liabilities 2020 = $7,491.5Accounts receivable 2020 = $1,615.1Inventory 2020 = $1,426.3Year-end closing stock price May 2020 = $58.80Year-end closing stock price May 2019 = $53.56 To calculate averages use (current year balance + poor year balance) / 2) Round percentages to 1 decimal place; round other answers to 2 decimal places.arrow_forwardA condensed income statement for Weber Associates and a partially completed vertical analysis follow. Required: 1. Complete the vertical analysis by computing each missing line item as a percentage of net revenues. TIP: In the prior year, Cost of Goods Sold was 31 percent of Net Revenues, computed as ($1,397 ÷ $4,571). 2. Does Cost of Goods Sold, as a percentage of Net Revenues, represent better or worse performance in 2019 as compared to 2018? Complete this question by entering your answers in the tabs below. Required 1 Required 2 Complete the vertical analysis by computing each missing line item as a percentage of net revenues. TIP: In the prior year, Cost of Goods Sold was 31 percent of Net Revenues, computed as ($1,397 ÷ $4,571). (Decreases should be indicated by a minus sign. Round your answers to the nearest whole percent.) Net Revenues Cost of Goods Sold Research and Development Expense Sales and Marketing Expense General and Administrative Expense Income from Operations Other…arrow_forwardConsider the comparative balance sheet and income statement for Starbucks provided in the shown Figures . Based on these financial statements, determine the following for the year September 30, 2018: Solve,d. Acid test ratio. e. Accounts receivable turnover. f. Inventory turnover.arrow_forward
arrow_back_ios
SEE MORE QUESTIONS
arrow_forward_ios
Recommended textbooks for you
 Cornerstones of Financial AccountingAccountingISBN:9781337690881Author:Jay Rich, Jeff JonesPublisher:Cengage Learning
 Managerial Accounting: The Cornerstone of Busines...AccountingISBN:9781337115773Author:Maryanne M. Mowen, Don R. Hansen, Dan L. HeitgerPublisher:Cengage Learning
 Survey of Accounting (Accounting I)AccountingISBN:9781305961883Author:Carl WarrenPublisher:Cengage Learning
 Principles of Accounting Volume 1AccountingISBN:9781947172685Author:OpenStaxPublisher:OpenStax College
 Managerial AccountingAccountingISBN:9781337912020Author:Carl Warren, Ph.d. Cma William B. TaylerPublisher:South-Western College Pub
Cornerstones of Financial Accounting
Accounting
ISBN:9781337690881
Author:Jay Rich, Jeff Jones
Publisher:Cengage Learning
Managerial Accounting: The Cornerstone of Busines...
Accounting
ISBN:9781337115773
Author:Maryanne M. Mowen, Don R. Hansen, Dan L. Heitger
Publisher:Cengage Learning
Survey of Accounting (Accounting I)
Accounting
ISBN:9781305961883
Author:Carl Warren
Publisher:Cengage Learning
Principles of Accounting Volume 1
Accounting
ISBN:9781947172685
Author:OpenStax
Publisher:OpenStax College
Managerial Accounting
Accounting
ISBN:9781337912020
Author:Carl Warren, Ph.d. Cma William B. Tayler
Publisher:South-Western College Pub
Financial ratio analysis; Author: The Finance Storyteller;https://www.youtube.com/watch?v=MTq7HuvoGck;License: Standard Youtube License