
Concept explainers
Videos
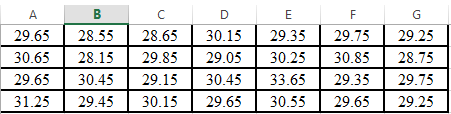
Given these data
| 29.65 | 28.55 | 28.65 | 30.15 | 29.35 | 29.75 | 29.25 |
| 30.65 | 28.15 | 29.85 | 29.05 | 30.25 | 30.85 | 28.75 |
| 29.65 | 30.45 | 29.15 | 30.45 | 33.65 | 29.35 | 29.75 |
| 31.25 | 29.45 | 30.15 | 29.65 | 30.55 | 29.65 | 29.25 |
Determine
(a) The Mean,
(b) The standard deviation,
(c) The variance,
(d) The coefficient of variation, and
(e) The 90% confidence interval for the mean
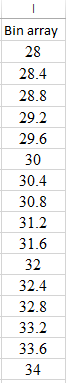
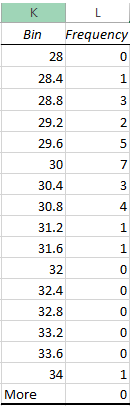
(f) Construct a histogram. Use a range from 28 to 34 with increments of 0.4
(g) Assuming that the distribution is normal and that your estimate of the standard deviation is valid, compute the range (that is, the lower and the upper values) that encompasses 68% of the readings.
Determine whether this is a valid estimate for the data in this problem.
(a)
To calculate: The mean of the given data.
| 29.65 | 28.55 | 28.65 | 30.15 | 29.35 | 29.75 | 29.25 |
| 30.65 | 28.15 | 29.85 | 29.05 | 30.25 | 30.85 | 28.75 |
| 29.65 | 30.45 | 29.15 | 30.45 | 33.65 | 29.35 | 29.75 |
| 31.25 | 29.45 | 30.15 | 29.65 | 30.55 | 29.65 | 29.25 |
Answer to Problem 2P
Solution:
The mean of the given data is
Explanation of Solution
Given Information:
The data is,
| 29.65 | 28.55 | 28.65 | 30.15 | 29.35 | 29.75 | 29.25 |
| 30.65 | 28.15 | 29.85 | 29.05 | 30.25 | 30.85 | 28.75 |
| 29.65 | 30.45 | 29.15 | 30.45 | 33.65 | 29.35 | 29.75 |
| 31.25 | 29.45 | 30.15 | 29.65 | 30.55 | 29.65 | 29.25 |
Calculation:
The mean of the data can be found out with the help of excel as shown below,
Step 1. First put the data in the excel as shown below,
Step 2. Use AVERAGE command in excel as shown below,
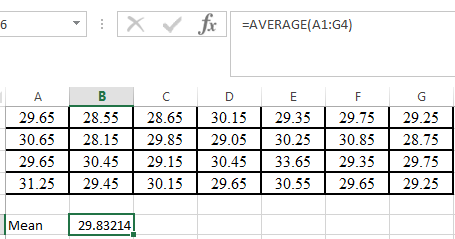
Hence, the mean of the given data is
(b)
To calculate: The standard deviation of the given data.
| 29.65 | 28.55 | 28.65 | 30.15 | 29.35 | 29.75 | 29.25 |
| 30.65 | 28.15 | 29.85 | 29.05 | 30.25 | 30.85 | 28.75 |
| 29.65 | 30.45 | 29.15 | 30.45 | 33.65 | 29.35 | 29.75 |
| 31.25 | 29.45 | 30.15 | 29.65 | 30.55 | 29.65 | 29.25 |
Answer to Problem 2P
Solution:
The standard deviation of the given data is
Explanation of Solution
Given Information:
The data is,
| 29.65 | 28.55 | 28.65 | 30.15 | 29.35 | 29.75 | 29.25 |
| 30.65 | 28.15 | 29.85 | 29.05 | 30.25 | 30.85 | 28.75 |
| 29.65 | 30.45 | 29.15 | 30.45 | 33.65 | 29.35 | 29.75 |
| 31.25 | 29.45 | 30.15 | 29.65 | 30.55 | 29.65 | 29.25 |
Calculation:
The standard deviation of the data can be found out with the help of excel as shown below,
Step 1. First put the data in the excel as shown below,
Step 2. Use STDEV command in excel as shown below,
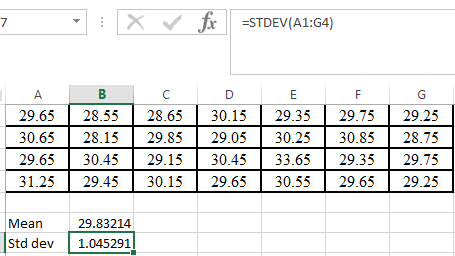
Hence, the standard deviation of the given data is
(c)
To calculate: The variance of the given data.
| 29.65 | 28.55 | 28.65 | 30.15 | 29.35 | 29.75 | 29.25 |
| 30.65 | 28.15 | 29.85 | 29.05 | 30.25 | 30.85 | 28.75 |
| 29.65 | 30.45 | 29.15 | 30.45 | 33.65 | 29.35 | 29.75 |
| 31.25 | 29.45 | 30.15 | 29.65 | 30.55 | 29.65 | 29.25 |
Answer to Problem 2P
Solution:
The variance of the given data is
Explanation of Solution
Given Information:
The data is,
| 29.65 | 28.55 | 28.65 | 30.15 | 29.35 | 29.75 | 29.25 |
| 30.65 | 28.15 | 29.85 | 29.05 | 30.25 | 30.85 | 28.75 |
| 29.65 | 30.45 | 29.15 | 30.45 | 33.65 | 29.35 | 29.75 |
| 31.25 | 29.45 | 30.15 | 29.65 | 30.55 | 29.65 | 29.25 |
Calculation:
The variance of the data can be found out with the help of excel as shown below,
Step 1. First put the data in the excel as shown below,
Step 2. Use VAR command in excel as shown below,
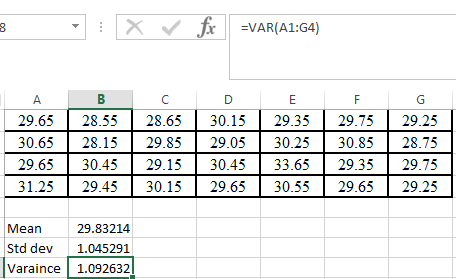
Hence, the variance of the given data is
(d)
To calculate: The coefficient of variation of the given data.
| 29.65 | 28.55 | 28.65 | 30.15 | 29.35 | 29.75 | 29.25 |
| 30.65 | 28.15 | 29.85 | 29.05 | 30.25 | 30.85 | 28.75 |
| 29.65 | 30.45 | 29.15 | 30.45 | 33.65 | 29.35 | 29.75 |
| 31.25 | 29.45 | 30.15 | 29.65 | 30.55 | 29.65 | 29.25 |
Answer to Problem 2P
Solution:
The coefficient of variation of the given data is
Explanation of Solution
Given Information:
The data is,
| 29.65 | 28.55 | 28.65 | 30.15 | 29.35 | 29.75 | 29.25 |
| 30.65 | 28.15 | 29.85 | 29.05 | 30.25 | 30.85 | 28.75 |
| 29.65 | 30.45 | 29.15 | 30.45 | 33.65 | 29.35 | 29.75 |
| 31.25 | 29.45 | 30.15 | 29.65 | 30.55 | 29.65 | 29.25 |
Formula used:
The coefficient of variation is
Calculation:
The coefficient of variation of the data can be found out with the help of excel as shown below,
Step 1. First put the data in the excel as shown below,
Step 2. Use the coefficient of variation formula as shown below,
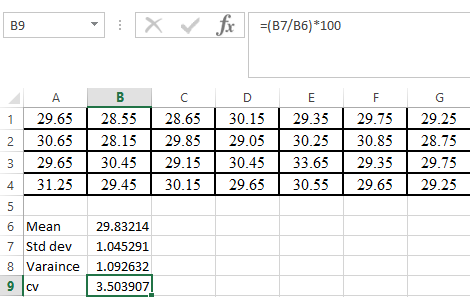
Hence, the coefficient of variation of the given data is
(e)
To calculate: The
| 29.65 | 28.55 | 28.65 | 30.15 | 29.35 | 29.75 | 29.25 |
| 30.65 | 28.15 | 29.85 | 29.05 | 30.25 | 30.85 | 28.75 |
| 29.65 | 30.45 | 29.15 | 30.45 | 33.65 | 29.35 | 29.75 |
| 31.25 | 29.45 | 30.15 | 29.65 | 30.55 | 29.65 | 29.25 |
Answer to Problem 2P
Solution:
The
Explanation of Solution
Given Information:
The data is,
| 29.65 | 28.55 | 28.65 | 30.15 | 29.35 | 29.75 | 29.25 |
| 30.65 | 28.15 | 29.85 | 29.05 | 30.25 | 30.85 | 28.75 |
| 29.65 | 30.45 | 29.15 | 30.45 | 33.65 | 29.35 | 29.75 |
| 31.25 | 29.45 | 30.15 | 29.65 | 30.55 | 29.65 | 29.25 |
Formula used:
The upper and lower range of confidence interval can be found out by,
Where
Calculation:
Here,
The t calculator value for the given values is,
Use the formula to calculate the lower range,
And the upper range is,
Hence, the
(f)
To graph: The histogram of the given data by using a range from
| 29.65 | 28.55 | 28.65 | 30.15 | 29.35 | 29.75 | 29.25 |
| 30.65 | 28.15 | 29.85 | 29.05 | 30.25 | 30.85 | 28.75 |
| 29.65 | 30.45 | 29.15 | 30.45 | 33.65 | 29.35 | 29.75 |
| 31.25 | 29.45 | 30.15 | 29.65 | 30.55 | 29.65 | 29.25 |
Explanation of Solution
Given Information:
The data is,
| 29.65 | 28.55 | 28.65 | 30.15 | 29.35 | 29.75 | 29.25 |
| 30.65 | 28.15 | 29.85 | 29.05 | 30.25 | 30.85 | 28.75 |
| 29.65 | 30.45 | 29.15 | 30.45 | 33.65 | 29.35 | 29.75 |
| 31.25 | 29.45 | 30.15 | 29.65 | 30.55 | 29.65 | 29.25 |
Graph:
The histogram of the data can be found out with the help of excel as shown below,
Step 1. First put the data in the excel as shown below,
Step 2. Now insert the bin array range as shown below,
Step 3. Select on DATA, Data Analysis, Histogram and then OK.
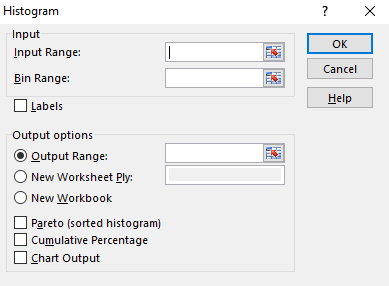
Step 4. Enter the input, Bin and output range as shown below,
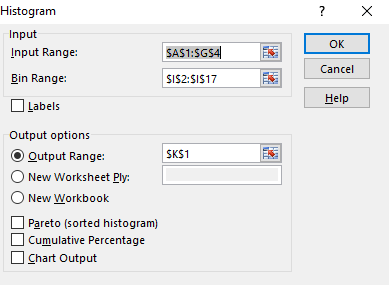
Step 5. The following result will appear.
Step 6. Now click on the insert and then column chart.
Interpretation:
It can be concluded from the histogram that 30 has repeated maximum time in the given data.
(g)
To calculate: The
| 29.65 | 28.55 | 28.65 | 30.15 | 29.35 | 29.75 | 29.25 |
| 30.65 | 28.15 | 29.85 | 29.05 | 30.25 | 30.85 | 28.75 |
| 29.65 | 30.45 | 29.15 | 30.45 | 33.65 | 29.35 | 29.75 |
| 31.25 | 29.45 | 30.15 | 29.65 | 30.55 | 29.65 | 29.25 |
Answer to Problem 2P
Solution:
The
Explanation of Solution
Given Information:
The data is,
| 29.65 | 28.55 | 28.65 | 30.15 | 29.35 | 29.75 | 29.25 |
| 30.65 | 28.15 | 29.85 | 29.05 | 30.25 | 30.85 | 28.75 |
| 29.65 | 30.45 | 29.15 | 30.45 | 33.65 | 29.35 | 29.75 |
| 31.25 | 29.45 | 30.15 | 29.65 | 30.55 | 29.65 | 29.25 |
Calculation:
As the
And,
From the Histogram, the data within this range
Thus, the percentage of data in this range is,
Which is higher than
Want to see more full solutions like this?
Chapter 17 Solutions
Numerical Methods For Engineers, 7 Ed
Additional Math Textbook Solutions
Fundamentals of Differential Equations (9th Edition)
Basic Technical Mathematics
Advanced Engineering Mathematics
High School Math 2012 Common-core Algebra 1 Practice And Problem Solvingworkbook Grade 8/9
University Calculus: Early Transcendentals (3rd Edition)


- Project 1 100 20. 150 200 250 300 350 400 450 500 550 600 650 CUPONTHFC-134a 700 200. 0.0016 1- 00018 10. Pressure-Enthalpy 0.0014 000124 0.0020 8. 0.0030 100. 80. 6. Diagram volume-0.0040 mikg (SI Units) 0.0060 0 0080 0.010 60. 40. 2. 0.015 0 020 20. 0030 0.8 0.040 10. 8. 0.6 0.060 0.4 6. 0 080 010 0.2 0.15 020 2. 0.1 0.08 0.30 0.40 1. 0.8 0.06 060 0.04 0.6 O80 1.0 0.4 0.02 1.5 20 0.2 0.01 100 150 200 250 300 350 400 450 0.1 700 500 550 600 650 Enthalpy (kJ/kg) Refrigerant HFC-134a as the working fluid - Ideal cycle operation condition is assumed Cycle is operated at high pressure line of 0.8 MPa Cycle is operated at low temperature line of – 10° C - Flow rate is 0.1 kg/sec The head of the department in the company that you are working in asked you to make use of pressure - enthalpy chart provided for HFC-134a refrigerant a. Construct didactic sketches, showing the operating principles of a refrigeration system Pressure (bar) 4. -Dozz -auneadu H 061 ta 091 Ti 1000 06 0 - --- 99'O 09…arrow_forwardProject 1 100 20. 150 200 250 300 350 400 450 500 550 600 650 QUPIDHFC-134a 700 200. 10. 8. 0.00124 o 0013 -0.0014 r0.0016 - 00018 0.0020 Pressure-Enthalpy 0.001 0.0030 6. Diagram 100. volume - 0.0040 mikg 80. (SI Units) 4. 0.0060 60. 0.0080 0.010 40. 2. 0.015 0 020 20. 1. O 030 0.040 0.8 10. 8. 0.6 0.060 0.4 0080 010 0.2 0.15 020 0.1 0.08 030 0.40 0.06 1. 0.8 0.60 0.04 O80 0.6 1.0 0.4 0.02 15 20 0.2 0.01 100 150 200 250 300 350 400 450 500 0.1 700 550 600 650 Enthalpy (kJ/kg) Refrigerant HFC-134a as the working fluid (the P-h chart is attached to this activity look at page 3) - Ideal cycle operation condition is assumed Cycle is operated at high pressure line of 0.8 MPa Cycle is operated at low temperature line of – 10° C Flow rate is 0.1 kg/sec Task.1 1. Determine the Refrigeration effect (RE), heat of compression (HOC), and heat of rejection (HOR) and their corresponding rate/power values in kW. 2. Estimate the COPR 3. Determine the low-pressure line value. Pressure (bar) 4. 2. OPद…arrow_forwardProject 1 100 20. 150 200 250 300 350 400 450 500 550 600 650 QUPINHFC-134a 700 200. 00012 00013 0.0014 r0.0016 J00018 10. Pressure-Enthalpy 0.0020 8. 0.0030 100. 80. 6. Diagram volume 0.0040 mikg (SI Units) 0.0060 0 0080 0.010 4. 60. 40. 2. 0.015 0 020 20. 1. 0.8 0030 0.040 10. 8. 0.6 0.060 0.4 6. 0.080 010 0.2 0.15 020 2. 0.1 0.30 0.08 0.40 1. 0.8 0.06 060 0.04 0.6 O80 1.0 0.4 0.02 15 20 0.2 0.01 100 150 200 250 300 350 400 450 0.1 700 500 550 600 650 Enthalpy (kJ/kg) Refrigerant HFC-134a as the working fluid Ideal cycle operation condition is assumed - Cycle is operated at high pressure line of 0.8 MPa - Cycle is operated at low temperature line of – 10° C - Flow rate is 0.1 kg/sec The head of the department in the company that you are working in asked you to make use of pressure -enthalpy chart provided for HFC-134a refrigerant Task.1 1. Determine the Refrigeration effect (RE), heat of compression (HOC), and heat of rejection (HOR) and their corresponding rate/power values in kW.…arrow_forward
- The wind data of a site is listed below. The data summarizes the wind speeds and their respective frequencies at the hub height of the turbine described below: Parameters: Turbine rotor diameter: 70.0 m Overall efficiency: 33% 3 Site air density 1.16 kg/m generator disengaged for the input values below 30% of the rated power Generator cutoff low speeds: High speeds: load dumping up to 3 times the rated power Determine a generator size that maximizes the annual energy output. Consider generator ratings in increments of 25 kW. Express the final answer in kWh.arrow_forwardA study was made on the amount of converted sugar in a certain process at various temperatures. The data were coded and recorded as follows: Temperature, x: 1.0 1.1 1.2 1.3 1.4 11.5 1.6 1.7 1.8 1.9 2.0 Converted Sugar, y : 8.1 8.8 8.5 9.8 9.5 8.9 8.6 10.2 9.3 10.2 10.5 Estimate the mean amount of converted sugar produced when the coded temperature is 2.8. (2 decimal places)arrow_forward3. Examine your data in Data Table 2 and in Data Table 3. For the data with the smallest percentage difference, compare the total energy at each point. Calculate the sum U₁+Ug at x₁ as ½kx-mgx₁. Calculate that sum at x₂ as ½kx²-mgx₂. Do you expect them to agree reasonably well? Explain why they should or should not be the same. 4. Consider the same data as used in Question 3. Calculate the value of x halfway between x₁ and x₂. Calculate U₁+Ug=½kx² − mgx_for_that point. Do you expect them to agree with the energy calculated in Question 3? If they agree reasonably well, explain why they do. If they do not agree, explain why they do not agree.arrow_forward
- Use the steam tables provided and DO NOT ROUND the values trom the steam table. Write down the values taken from the steam table. 1.) Air undergoes an Isentropic process where it expands. It is initially at 900K then the temperature decreases to 300K. Find a.) Wn, b.) Q, c.) Ah, and d.) draw the P-V and T-S diagram 2.) An Isothermal process is done on air, and it has a pressure of 500 kPa and a volume of 0.5m3. The pressure then increases to 1.1 MPa Find the a.) final volume, b.) Q, c.) Wn, and d.) draw the P-V and T-S diagramarrow_forwardA quartz mixture is screened through a standard 14 mesh screen. The mass of feed, oversize and undersize are given below in the table. MeshDiameter Mass (kg) No. (mm) FeedoversizeUndersize 3.3 5 8 2.4 24 10 1.7 38 49 19 14 1.2 25 15 36 20 0.8 15 25 28 0.6 3 1 35 0.4 3 6. 65 0.2 Pan 3 Calculate screen effectiveness.arrow_forwardA company that manufacturers gas cylinder is interested in assessing the relationship between pressure dependent variable and volume of the gas independent variable. The table below gives experimental values of pressure of a given mass of gas corresponding to various of the volume. According to the thermodynamic principles, the relationship be of the form of PVy=C where y and C are constants Volume 53.3 61.8 72.4 88.7 119 194 Pressure 61.2 49.5 37.6 28.4 19.2 10 Find the values y and c that best fit the dataarrow_forward
- A firm provides solution regarding forecast over a 6 month cycle. The following data is regarding the present task of forecast being worked out by the firm. Determine the forecast for the month of April. Month Demand Jan 200 Feb 100 Mar 350 A 108.33 162.5 WRONG C C 216.667 D 384.12arrow_forward2.) An actual Rankine Engine is used to power a generator. The steam enters its turbine at 4 MPa and 300C then expands in an irreversible adiabatic process where it becomes saturated vapor. It enters the condenser with a pressure of 5 kPa. Find Ec, W(W¡, Wg, Wk) the remaining engine efficiencies(n,, Ng, Nx), thermal efficiencies(e,, eg, ex),SR(SR¡, SRB, SR%), HR(HR¡, HRB, HRx) obtained if the turbogenerator has 85% mechanical efficiency and 90% generator kJ efficiency. 2822.88 kg W e SR HR kJ 399.2 kg kJ 339.32 kg kJ 305.39 kg kg 9.02 kWh kJ 25456.73 kWh I 39.08% 14.14% kg 10.61 kWh kJ 29949.35 kWh В 33.22% 12.02% kg 11.79 kWh kJ 33276.96 kWh k 29.89% 10.82% complete solution and units. Use the steam tables provided and use 4 decimal places for solving. Final answers shown are rounded in 2 decimal places. Draw the T-S diagram properly with respect to saturation line Specific Volume Set Internal Energy Enthalpy Sat. Vapor h, Preas. MP Tep Entropy Sat. Vapor 10s Sat. Liquid Sat. Vapor…arrow_forwardThe following data represents the relation between the heat capacity of a plate (q) and time (t). If the relation between the leachate and time is given by the form q-ab^t. : Determine q = ab² 1 3.0 4.0 5.0 6.0 7.0 8.0 9.0 10.0 1.0 2.0 8.00 7.15 5.25 3.65 2.50 2.35 2.25 1.50 1.25 1.00 9 the the heat capacity at (1 time equal to 15 0.28 O 0.29 O 0.30 Oarrow_forward
 Elements Of ElectromagneticsMechanical EngineeringISBN:9780190698614Author:Sadiku, Matthew N. O.Publisher:Oxford University Press
 Mechanics of Materials (10th Edition)Mechanical EngineeringISBN:9780134319650Author:Russell C. HibbelerPublisher:PEARSON
 Thermodynamics: An Engineering ApproachMechanical EngineeringISBN:9781259822674Author:Yunus A. Cengel Dr., Michael A. BolesPublisher:McGraw-Hill Education
 Control Systems EngineeringMechanical EngineeringISBN:9781118170519Author:Norman S. NisePublisher:WILEY
 Mechanics of Materials (MindTap Course List)Mechanical EngineeringISBN:9781337093347Author:Barry J. Goodno, James M. GerePublisher:Cengage Learning
 Engineering Mechanics: StaticsMechanical EngineeringISBN:9781118807330Author:James L. Meriam, L. G. Kraige, J. N. BoltonPublisher:WILEY