
Concept explainers
Videos
Recompute the regression fits from Probs. (a) 17.3 and (b) 17.17, using the matrix approach. Estimate the standard errors and develop 90% confidence intervals for the coefficients.
(a)
To calculate: The coefficient of the regression fit equation of the given databy the use of matrix approach and then calculate standard error and
| x | 0 | 2 | 4 | 6 | 9 | 11 | 12 | 15 | 17 | 19 |
| y | 5 | 6 | 7 | 6 | 9 | 8 | 7 | 10 | 12 | 12 |
Answer to Problem 22P
Solution:
The value of coefficient by the use of matrix approach is
Explanation of Solution
Given Information:
The data is,
| x | 0 | 2 | 4 | 6 | 9 | 11 | 12 | 15 | 17 | 19 |
| y | 5 | 6 | 7 | 6 | 9 | 8 | 7 | 10 | 12 | 12 |
Calculation:
The coefficient of the regression fit equation can be found out by the Matrix approach by following the below steps,
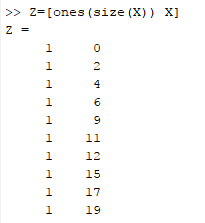
Step 1. First make Z matrix that contain column of ones in the first column and in the second column x value is shown.
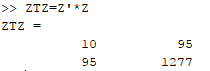
Step 2. Now the coefficient of normal equation is made.
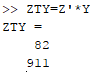
Step 3. Now compute the normal equation of the right hand side that is y data.
Step 4. The coefficient of the model can be found out by taking inverse of the result obtained in step 2 and step 3.
The following MATLAB will perform the desired steps,
On the command window, write this command as,
Now, the coefficient of normal equation is calculated as,
Now, the normal equation of y is calculated as,
Finally, the coefficient of the model can be found out,
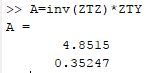
Therefore, the value of coefficientis
Now, for calculating the standard error follow these commands,
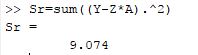
Now calculate
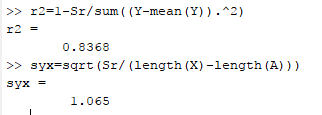
The standard error of the given data is
Now for calculating
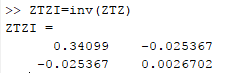
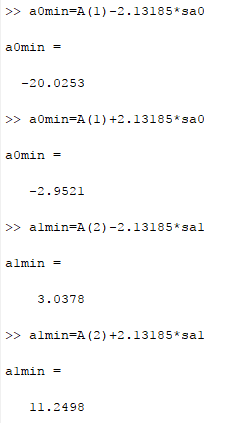
Then the standard error of each coefficient,
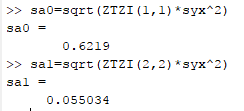
Thevalue of
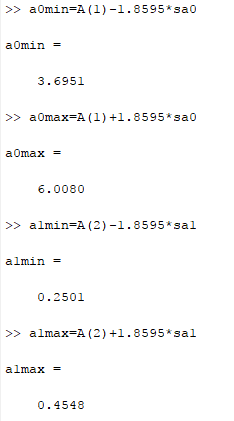
Hence, the
(b)
To calculate: The coefficient of the regression fit cubic equation of the given databy the use of matrix approach and then calculate standard error and
| x | 3 | 4 | 5 | 7 | 8 | 9 | 11 | 12 |
| y | 1.6 | 3.6 | 4.4 | 3.4 | 2.2 | 2.8 | 3.8 | 4.6 |
Answer to Problem 22P
Solution:
The value of coefficient by the use of matrix approach is
Explanation of Solution
Given Information:
The data is,
| x | 3 | 4 | 5 | 7 | 8 | 9 | 11 | 12 |
| y | 1.6 | 3.6 | 4.4 | 3.4 | 2.2 | 2.8 | 3.8 | 4.6 |
Calculation:
The coefficient of the regression fit equation can be found out by the Matrix approach by following the below steps,
Step 1. First make Z matrix that contain column of ones in the first column and in the second column x value is shown.
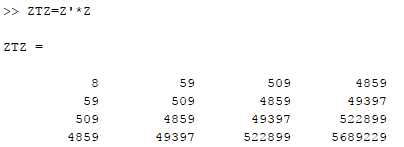
Step 2. Now the coefficient of normal equation is made.
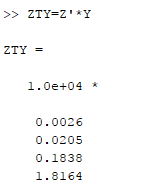
Step 3. Now compute the normal equation of the right hand side that is y data.
Step 4. The coefficient of the model can be found out by taking inverse of the result obtained in step 2 and step 3.
The following MATLAB will perform the desired steps,
On the command window, write this commandfor cubic equation as,
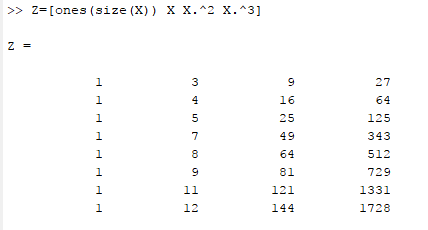
Now, the coefficient of normal equation is calculated as,
Now, the normal equation of y is calculated as,
Finally, the coefficient of the model can be found out,
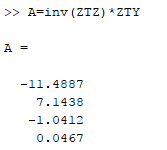
Therefore, the value of coefficient is
Now, for calculating the standard error follow these commands,
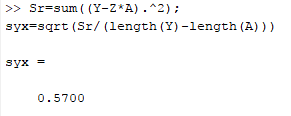
The standard error of the given data is
Now for calculating
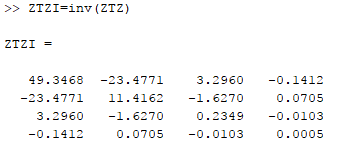
Then the standard error of each coefficient,
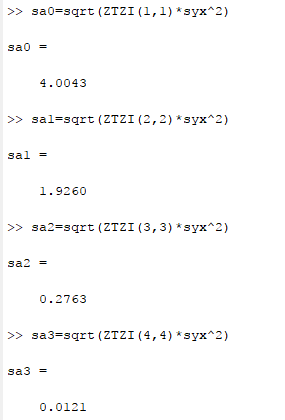
The value of
And,
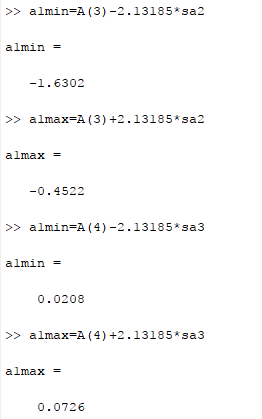
Hence, the
Want to see more full solutions like this?
Chapter 17 Solutions
Numerical Methods For Engineers, 7 Ed


- As an industrial engineer, you intend to use linear trend (or linear regression) method to solve a forecasting problem. You have decided to use the equation of y = m(x) + c to establish the relationship between the sales (y) and the related month (x). It is known that 8 consecutive months data (Jan to Aug) were used and they resulted to the following parameter values of m = 320 and c = 1017. Using the regression technique, estimate the percentage of sales improvement from December this year to June next year.arrow_forward4. Develop a model using regression analysis for trip production using the following data. Zone Number Trip production Trip Vehicle Employment attraction ownership 1 200 1 1000 256 1.5 1250 345 2500 6. 451 2.8 3600 5 6.5 555 4200 6. 7 600 4 4500 3. 2. 3. 2. 3. 4.arrow_forwardThe following table presents the highway gasoline mileage performance and engine displacement for Audi vehicles for model year 2005. a) (5 Pts.) Fit simple linear model. Test for significance of the regression using alpha=0.05. Find the p-value for this test. What conclusions you can reach? b) (5 Pts.) Test Ho: P₁= -0.05 versus H₁: ₁arrow_forward
- For the Thermistor given below using piecewise approximation method combined with line regression to find the best equation and value for Temperature if the system has counts =800 20 40 60 80 |ADC counts 928 785 654 420 152 T=129.7902-0.14586*Counts, T= 13.1022 T=129.7902-0.13986*Counts, T=17.9021 T=129.7902-0.12358*Counts, T= 30.9262 T=135.4745-0.14599*Counts, T= 18.68613arrow_forwardAbout supervised machine learning, in the context of Linear Regression; Decision tree; Logistics Regresion; Randon forest and neural network, which metrics should be used to know if a classification model is good and why use them? What about regression, what metrics are used to say how good the model is? What is the best for each case?arrow_forwarddetermine the regression line equation plot the line on a graph and summarize the results( reject or do not) is there enough evidence? please and thank you!arrow_forward
- Linearize the model ? = ? ? ?^(?? )and solve for the coefficients by hand using the following data x 0.1 0.2 0.4 0.6 0.9 1.3 1.5 1.7 1.8 y 0.75 1.25 1.45 1.25 0.85 0.55 0.35 0.28 0.18arrow_forwardForest Fires and Acres Burned Numbers (in thousands) of forest fires over the year and the number (in hundred thousands) of acres burned for 6 recent years are shown. The regression line equation is y'=-18.779+0.761x. The standard error of the estimate is sest 9.55. Find the 80% interval when x=60. Round intermediate answers to three decimal places. Round your final answers to two decimal places as needed. Number of fires x 58 47 84 62 57 45 Number of acres burned y 19 26 51 15 30 15 Send data to Excel One can be 80% confident that the intervalarrow_forwardcomputational methods - linear regression do not use spreadsheet program to find answer.arrow_forwardHello Sir.Good night.Permission, i have a question in my homework related numerical methods lesson. The following bellow is question. Please advice. Thank you so much Regards,Irfan Mention the types of problems that exist in the field of engineering, especially mechanical engineering that can be solved by the linear regression methodarrow_forwardQ=What is the importance of regression analysis in transportation engineering? ANSWER in word fomatarrow_forward6. A computer software package calculated some numerical summaries of a sample of data. The results are displayed here: Variable N Mean SE Mean StDev Variance 20 50.184 ? 1.816 ? (a) Fill in the missing quantities. (b) What is the estimate of the mean of the population from which this sample was drawn?arrow_forwardarrow_back_iosSEE MORE QUESTIONSarrow_forward_ios
 Elements Of ElectromagneticsMechanical EngineeringISBN:9780190698614Author:Sadiku, Matthew N. O.Publisher:Oxford University Press
 Mechanics of Materials (10th Edition)Mechanical EngineeringISBN:9780134319650Author:Russell C. HibbelerPublisher:PEARSON
 Thermodynamics: An Engineering ApproachMechanical EngineeringISBN:9781259822674Author:Yunus A. Cengel Dr., Michael A. BolesPublisher:McGraw-Hill Education
 Control Systems EngineeringMechanical EngineeringISBN:9781118170519Author:Norman S. NisePublisher:WILEY
 Mechanics of Materials (MindTap Course List)Mechanical EngineeringISBN:9781337093347Author:Barry J. Goodno, James M. GerePublisher:Cengage Learning
 Engineering Mechanics: StaticsMechanical EngineeringISBN:9781118807330Author:James L. Meriam, L. G. Kraige, J. N. BoltonPublisher:WILEY